NetSpend 2011 Annual Report Download - page 47
Download and view the complete annual report
Please find page 47 of the 2011 NetSpend annual report below. You can navigate through the pages in the report by either clicking on the pages listed below, or by using the keyword search tool below to find specific information within the annual report.-
 1
1 -
2
-
3
-
4
-
5
-
6
-
7
-
8
-
9
-
10
-
11
-
12
-
13
-
14
-
15
-
16
-
17
-
18
-
19
-
20
-
21
-
22
-
23
-
24
-
25
-
26
-
27
-
28
-
29
-
30
-
31
-
32
-
33
-
34
-
35
-
36
-
 37
37 -
 38
38 -
 39
39 -
 40
40 -
 41
41 -
 42
42 -
 43
43 -
 44
44 -
 45
45 -
 46
46 -
 47
47 -
 48
48 -
 49
49 -
 50
50 -
 51
51 -
 52
52 -
 53
53 -
 54
54 -
 55
55 -
 56
56 -
 57
57 -
58
-
59
-
60
-
61
-
62
-
63
-
64
-
65
-
66
-
67
-
68
-
69
-
70
-
71
-
72
-
73
-
74
-
75
-
76
-
77
-
78
-
79
-
80
-
81
-
82
-
83
-
84
-
85
-
86
-
87
-
88
-
89
-
90
-
91
-
92
-
93
-
94
-
95
-
96
-
97
-
98
-
99
-
100
-
101
-
102
-
103
-
104
-
105
-
106
-
107
-
108
-
109
-
110
-
111
-
112
-
113
-
114
-
115
-
116
-
117
-
118
-
119
-
120
-
121
-
122
-
123
-
124
-
125
-
126
-
127
-
128
-
129
-
130
-
131
-
132
-
133
-
134
-
135
-
136
-
137
-
138
-
139
-
140
-
141
-
142
-
143
-
144
-
145
-
146
-
147
-
148
-
149
-
150
-
151
-
152
-
153
-
154
-
155
-
156
-
157
-
158
-
159
-
160
-
161
-
162
-
163
-
164
-
165
-
166
-
167
-
168
-
169
-
170
-
171
-
172
-
173
 |
 |

Table of Contents
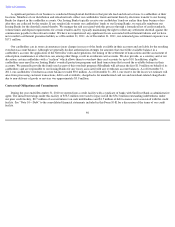
Liquidity and Capital Resources
Our primary sources of liquidity are cash flow from our operating activities and access to borrowings under our credit facilities.
Comparison of Fiscal 2011, 2010 and 2009
Cash Flows from Operating Activities
During fiscal 2011, our operating activities provided $48.8 million of cash, resulting from $33.2 million of net income and an adjustment
of $36.9 million for non-cash items, offset by $21.3 million in cash used by operating assets and liabilities. The $36.9 million adjustment for
non-cash items primarily relates to $15.0 million of depreciation and amortization expense, a $14.4 million provision for cardholder losses and
$11.2 million of stock-based compensation expense, offset by $2.6 million in deferred income taxes and $1.5 million of tax benefits associated
with stock options. The $21.3 million in cash used by changes in operating assets and liabilities was primarily the result of a $3.8 million
decrease in our accounts payable and accrued liabilities primarily caused by the payout in 2011 of bonuses earned in 2010 as well as final
payout in 2011 of a 2010 settlement loss related to a patent infringement dispute, $15.3 million of write-offs flowing against our cardholders'
reserve, a $2.3 million increase in other long-term assets and a $2.1 million increase in accounts receivable, offset by a $2.9 million increase in
income tax payable.
The $48.8 million of 2011 operating cash flows represents a $3.3 million decrease over 2010 operating cash flows of $52.1 million. The
$3.3 million decrease in operating cash flows primarily relates to a $23.3 million decrease in cash provided by changes in operating assets and
liabilities, partially offset by a $10.5 million increase in net income and a $9.5 million increase in non-cash item adjustments. During 2010,
$2.0 million of cash was provided by changes in operating assets and liabilities while $21.3 million of cash was used by changes in operating
assets and liabilities during 2011. This $23.3 million decrease in cash provided by changes in operating assets and liabilities was primarily due
to a $6.7 million decrease in cash provided by accounts payable and accrued liabilities as well as $8.3 million of incremental write-
offs flowing
against our cardholders' reserve during 2011 as compared to 2010 due to incremental fraud losses and expansion of our overdraft program.
During fiscal 2010, our operating activities provided $52.1 million of cash, resulting from $22.7 million of net income and an adjustment of
$27.4 million for non-cash items and $2.0 million in cash provided by operating assets and liabilities. The $27.4 million adjustment for non-
cash items primarily relates to $12.7 million of depreciation and amortization expense, a $10.3 million provision for cardholder losses,
$7.3 million of stock-based compensation expense offset by $1.5 million in deferred income taxes and $2.5 million in tax benefit associated
with stock options. The $52.1 million of 2010 operating cash flows represents a $15.9 million increase over 2009 operating cash flows of
$36.2 million. The $15.9 million increase in operating cash flows primarily relates to a $9.8 million year-over-year increase in net income
adjusted for non-cash items.
During fiscal 2009, our operating activities provided $36.2 million of cash, resulting from $18.2 million of net income and an adjustment
of $22.1 million for non-cash items, offset by $4.1 million in
43
Year Ended December 31,
2011 2010 2009
(in thousands of dollars)
Net cash provided by operating activities
$
48,847
$
52,101
$
36,195
Net cash used in investing activities
(10,088
)
(9,259
)
(14,741
)
Net cash provided by (used in) financing activities
(34,184
)
3,505
(21,790
)
Net change in cash and cash equivalents
$
4,575
$
46,347
$
(336
)