NetSpend 2011 Annual Report Download - page 88
Download and view the complete annual report
Please find page 88 of the 2011 NetSpend annual report below. You can navigate through the pages in the report by either clicking on the pages listed below, or by using the keyword search tool below to find specific information within the annual report.-
 1
1 -
2
-
3
-
4
-
5
-
6
-
7
-
8
-
9
-
10
-
11
-
12
-
13
-
14
-
15
-
16
-
17
-
18
-
19
-
20
-
21
-
22
-
23
-
24
-
25
-
26
-
27
-
28
-
29
-
30
-
31
-
32
-
33
-
34
-
35
-
36
-
37
-
38
-
39
-
40
-
41
-
42
-
43
-
44
-
45
-
46
-
47
-
48
-
49
-
50
-
51
-
52
-
53
-
54
-
55
-
56
-
57
-
58
-
59
-
60
-
61
-
62
-
63
-
64
-
65
-
66
-
67
-
68
-
69
-
70
-
71
-
72
-
73
-
74
-
75
-
76
-
77
-
 78
78 -
 79
79 -
 80
80 -
 81
81 -
 82
82 -
 83
83 -
 84
84 -
 85
85 -
 86
86 -
 87
87 -
 88
88 -
 89
89 -
 90
90 -
 91
91 -
 92
92 -
 93
93 -
 94
94 -
 95
95 -
 96
96 -
 97
97 -
 98
98 -
99
-
100
-
101
-
102
-
103
-
104
-
105
-
106
-
107
-
108
-
109
-
110
-
111
-
112
-
113
-
114
-
115
-
116
-
117
-
118
-
119
-
120
-
121
-
122
-
123
-
124
-
125
-
126
-
127
-
128
-
129
-
130
-
131
-
132
-
133
-
134
-
135
-
136
-
137
-
138
-
139
-
140
-
141
-
142
-
143
-
144
-
145
-
146
-
147
-
148
-
149
-
150
-
151
-
152
-
153
-
154
-
155
-
156
-
157
-
158
-
159
-
160
-
161
-
162
-
163
-
164
-
165
-
166
-
167
-
168
-
169
-
170
-
171
-
172
-
173
 |
 |
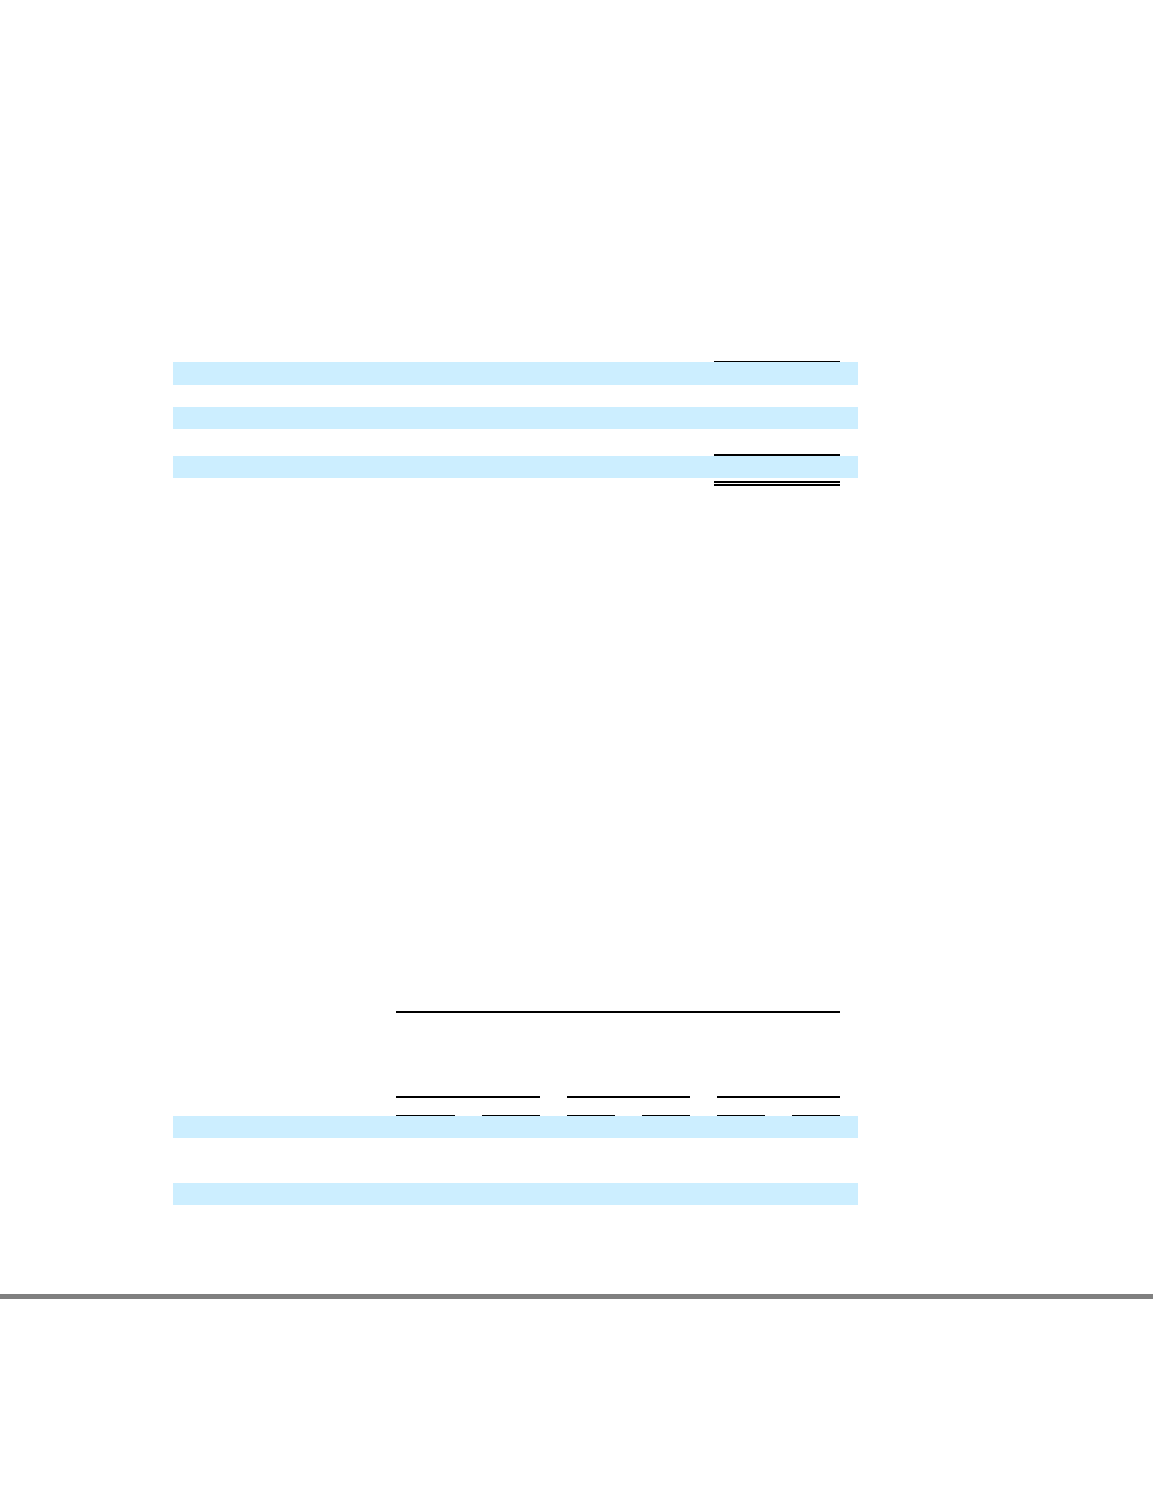
Table of Contents
NetSpend Holdings, Inc.
Notes to Consolidated Financial Statements (Continued)
December 31, 2011, 2010 and 2009
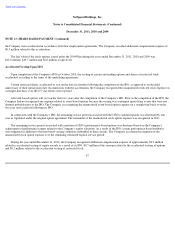
NOTE 10: DEBT (Continued)
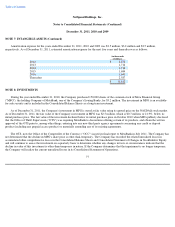
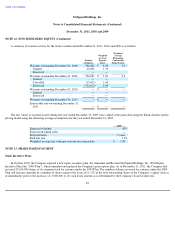
The following table presents the availability under the $135.0 million revolving credit facility as of December 31, 2011:
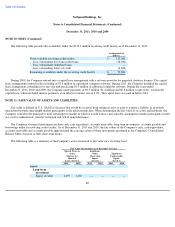
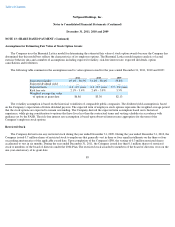
During 2009, the Company entered into a capital lease arrangement with a software provider for perpetual database licenses. The capital
lease arrangement resulted in the recording of $3.4 million in capitalized computer software. During 2011, the Company modified the capital
lease arrangement, extending it for one year and purchasing $1.9 million of additional computer software. During the years ended
December 31, 2011, 2010 and 2009, the Company made payments of $3.3 million, $1.4 million and $0.8 million, respectively, towards the
capital lease, which included interest payments at an effective interest rate of 6.0%. The capital lease was paid in full in 2011.
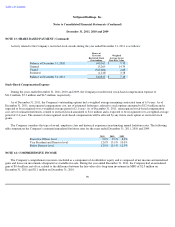
NOTE 11: FAIR VALUE OF ASSETS AND LIABILITIES
Fair value is defined in U.S. GAAP as the price that would be received from selling an asset or paid to transfer a liability in an orderly
transaction between arms-length market participants at the measurement date. When determining the fair value of its assets and liabilities, the
Company considers the principal or most advantageous market in which it would transact and considers assumptions market participants would
use, such as inherent risk, transfer restriction and risk of nonperformance.
The Company's financial instruments include cash, cash equivalents, accounts receivable, long-term investments, accounts payable and
borrowings under its revolving credit facility. As of December 31, 2011 and 2010, the fair values of the Company's cash, cash equivalents,
accounts receivable and accounts payable approximated the carrying values of these instruments presented in the Company's Consolidated
Balance Sheets because of their short-term nature.
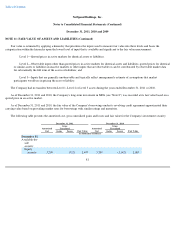
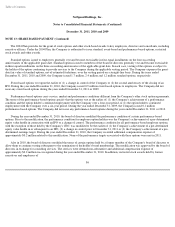
The following table is a summary of the Company's assets measured at fair value on a recurring basis:
80
(in thousands of
dollars)
Total available revolving credit facility
$
135,000
Less: outstanding revolving credit loans
(58,500
)
Less: outstanding swingline loans
—
Less: outstanding letters of credit
(6,200
)
Remaining availability under the revolving credit facility
$
70,300
Fair Value Measurement as of December 31 Using
Quoted Prices in
Active
Markets for
Identical
Assets (Level 1)
Significant
Other
Observable
Inputs
(Level 2)
Significant
Unobservable
Inputs
(Level 3)
2011 2010 2011 2010 2011 2010
Assets
Long
-
term
investment
Equity security
2,497
2,067
—
—
—
—