NetSpend 2011 Annual Report Download - page 73
Download and view the complete annual report
Please find page 73 of the 2011 NetSpend annual report below. You can navigate through the pages in the report by either clicking on the pages listed below, or by using the keyword search tool below to find specific information within the annual report.-
 1
1 -
2
-
3
-
4
-
5
-
6
-
7
-
8
-
9
-
10
-
11
-
12
-
13
-
14
-
15
-
16
-
17
-
18
-
19
-
20
-
21
-
22
-
23
-
24
-
25
-
26
-
27
-
28
-
29
-
30
-
31
-
32
-
33
-
34
-
35
-
36
-
37
-
38
-
39
-
40
-
41
-
42
-
43
-
44
-
45
-
46
-
47
-
48
-
49
-
50
-
51
-
52
-
53
-
54
-
55
-
56
-
57
-
58
-
59
-
60
-
61
-
62
-
 63
63 -
 64
64 -
 65
65 -
 66
66 -
 67
67 -
 68
68 -
 69
69 -
 70
70 -
 71
71 -
 72
72 -
 73
73 -
 74
74 -
 75
75 -
 76
76 -
 77
77 -
 78
78 -
 79
79 -
 80
80 -
 81
81 -
 82
82 -
 83
83 -
84
-
85
-
86
-
87
-
88
-
89
-
90
-
91
-
92
-
93
-
94
-
95
-
96
-
97
-
98
-
99
-
100
-
101
-
102
-
103
-
104
-
105
-
106
-
107
-
108
-
109
-
110
-
111
-
112
-
113
-
114
-
115
-
116
-
117
-
118
-
119
-
120
-
121
-
122
-
123
-
124
-
125
-
126
-
127
-
128
-
129
-
130
-
131
-
132
-
133
-
134
-
135
-
136
-
137
-
138
-
139
-
140
-
141
-
142
-
143
-
144
-
145
-
146
-
147
-
148
-
149
-
150
-
151
-
152
-
153
-
154
-
155
-
156
-
157
-
158
-
159
-
160
-
161
-
162
-
163
-
164
-
165
-
166
-
167
-
168
-
169
-
170
-
171
-
172
-
173
 |
 |

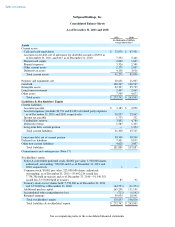
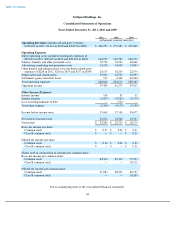
See accompanying notes to the consolidated financial statements.
65
treasury stock
—
—
—
—
—
—
(
4,319,844
)
(32,718
)
—
—
—
(
32,718
)
Tax withholding
on restricted
stock
—
—
—
—
—
—
(
68,542
)
(661
)
—
—
—
(
661
)
Stock-based
compensation
—
—
—
—
—
—
—
—
11,242
—
—
11,242
Exchange of
shares
700,000
1
(7,000,000
)
(7
)
—
—
—
—
6
—
—
—
Exercise of
options for
common stock
—
—
588,247
—
—
—
—
—
1,405
—
—
1,405
Tax benefit
associated
with stock
options
—
—
—
—
—
—
—
—
1,541
—
—
1,541
Vesting of
restricted
stock
—
—
363,606
—
—
—
—
—
—
—
—
—
Issuance cost of
public offering
—
—
—
—
—
—
—
—
(
95
)
—
—
(
95
)
Dividend
equivalents
paid
—
—
—
—
—
—
—
—
—
—
(
353
)
(353
)
Comprehensive
income:
Net income
—
—
—
—
—
—
—
—
—
—
33,246
33,246
Unrealized
gain on
available-
for-sale
investment
—
—
—
—
—
—
—
—
—
430
—
430
Total
comprehensive
income
—
—
—
—
—
—
—
—
—
—
—
33,676
Balances at
December 31,
2011
700,000
$
1
85,492,234
$
85
—
$
—
(
7,758,386
)
$
(44,753
)
$
165,298
$
(712
)
$
50,934
$
170,853