NetSpend 2011 Annual Report Download - page 96
Download and view the complete annual report
Please find page 96 of the 2011 NetSpend annual report below. You can navigate through the pages in the report by either clicking on the pages listed below, or by using the keyword search tool below to find specific information within the annual report.-
 1
1 -
2
-
3
-
4
-
5
-
6
-
7
-
8
-
9
-
10
-
11
-
12
-
13
-
14
-
15
-
16
-
17
-
18
-
19
-
20
-
21
-
22
-
23
-
24
-
25
-
26
-
27
-
28
-
29
-
30
-
31
-
32
-
33
-
34
-
35
-
36
-
37
-
38
-
39
-
40
-
41
-
42
-
43
-
44
-
45
-
46
-
47
-
48
-
49
-
50
-
51
-
52
-
53
-
54
-
55
-
56
-
57
-
58
-
59
-
60
-
61
-
62
-
63
-
64
-
65
-
66
-
67
-
68
-
69
-
70
-
71
-
72
-
73
-
74
-
75
-
76
-
77
-
78
-
79
-
80
-
81
-
82
-
83
-
84
-
85
-
 86
86 -
 87
87 -
 88
88 -
 89
89 -
 90
90 -
 91
91 -
 92
92 -
 93
93 -
 94
94 -
 95
95 -
 96
96 -
 97
97 -
 98
98 -
 99
99 -
 100
100 -
 101
101 -
 102
102 -
 103
103 -
 104
104 -
 105
105 -
 106
106 -
107
-
108
-
109
-
110
-
111
-
112
-
113
-
114
-
115
-
116
-
117
-
118
-
119
-
120
-
121
-
122
-
123
-
124
-
125
-
126
-
127
-
128
-
129
-
130
-
131
-
132
-
133
-
134
-
135
-
136
-
137
-
138
-
139
-
140
-
141
-
142
-
143
-
144
-
145
-
146
-
147
-
148
-
149
-
150
-
151
-
152
-
153
-
154
-
155
-
156
-
157
-
158
-
159
-
160
-
161
-
162
-
163
-
164
-
165
-
166
-
167
-
168
-
169
-
170
-
171
-
172
-
173
 |
 |

Table of Contents
NetSpend Holdings, Inc.
Notes to Consolidated Financial Statements (Continued)
December 31, 2011, 2010 and 2009
NOTE 13: SHARE BASED PAYMENT (Continued)
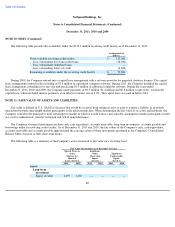
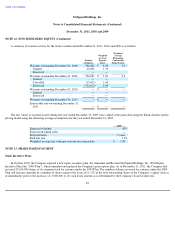
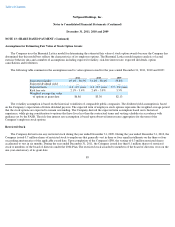
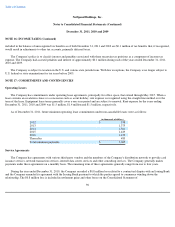
The following table presents a summary of stock option activity for the year ended December 31, 2011:
The aggregate intrinsic value in the table above represents the total pre-tax value of the options shown. This amount is equal to the
difference between the Company's closing stock price on December 31, 2011 ($8.11 per share) and the exercise prices of the options shown,
multiplied by the number of in-the-money options. This is the aggregate amount that would have been received by the option holders if they
had all exercised their options on December 31, 2011 and sold the shares received thereby at the closing price of the Company's stock on that
date. This amount changes based on the fair value of the Company's stock. The intrinsic value of options exercised during 2011, 2010 and 2009
was $3.7 million, $9.2 million and $0.1 million, respectively.
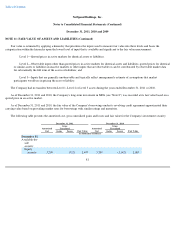
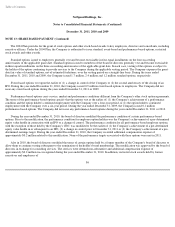
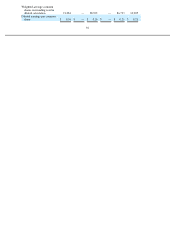
Options with the following characteristics were outstanding as of December 31, 2011:
88
Shares
Weighted
Average
Exercise
Price per Share
Weighted
Average
Remaining
Contractual
Term Aggregate
Intrinsic Value
Outstanding
December 31,
2010
11,035,606
$
3.88
7.8 years
$
98,705,957
Granted
1,743,629
13.55
Exercised
(588,247
)
2.39
Expired
(45,411
)
3.56
Forfeited
(747,867
)
5.90
Outstanding
December 31,
2011
11,397,710
$
5.31
6.9 years
$
42,674,370
Vested and expected
to vest at
December 31,
2011
10,408,215
$
5.29
7.1 years
$
39,084,826
Exercisable at
December 31,
2011
3,756,339
$
3.76
6.3 years
$
16,846,072
Options Outstanding Options Exercisable
Exercise Prices Number of
Shares
Weighted
Average
Remaining
Contractual
Life (Years)
Weighted
Average
Exercise Price Number
Exercisable
Weighted
Average
Exercise Price
$0.25 -
$3.47
2,256,840
5.6
$
3.16
960,427
$
3.07
3.53
4,903,157
6.2
3.53
2,279,147
3.53
3.78
2,047,175
8.0
3.78
362,514
3.78
5.58
-
11.48
830,948
9.0
9.89
141,751
11.00
14.70
50,000
8.9
14.70
12,500
14.70
14.80
1,309,590
9.0
14.80
—
—
11,397,710
6.9
$
5.31
3,756,339
$
3.76