NetSpend 2011 Annual Report Download - page 42
Download and view the complete annual report
Please find page 42 of the 2011 NetSpend annual report below. You can navigate through the pages in the report by either clicking on the pages listed below, or by using the keyword search tool below to find specific information within the annual report.-
 1
1 -
2
-
3
-
4
-
5
-
6
-
7
-
8
-
9
-
10
-
11
-
12
-
13
-
14
-
15
-
16
-
17
-
18
-
19
-
20
-
21
-
22
-
23
-
24
-
25
-
26
-
27
-
28
-
29
-
30
-
31
-
 32
32 -
 33
33 -
 34
34 -
 35
35 -
 36
36 -
 37
37 -
 38
38 -
 39
39 -
 40
40 -
 41
41 -
 42
42 -
 43
43 -
 44
44 -
 45
45 -
 46
46 -
 47
47 -
 48
48 -
 49
49 -
 50
50 -
 51
51 -
 52
52 -
53
-
54
-
55
-
56
-
57
-
58
-
59
-
60
-
61
-
62
-
63
-
64
-
65
-
66
-
67
-
68
-
69
-
70
-
71
-
72
-
73
-
74
-
75
-
76
-
77
-
78
-
79
-
80
-
81
-
82
-
83
-
84
-
85
-
86
-
87
-
88
-
89
-
90
-
91
-
92
-
93
-
94
-
95
-
96
-
97
-
98
-
99
-
100
-
101
-
102
-
103
-
104
-
105
-
106
-
107
-
108
-
109
-
110
-
111
-
112
-
113
-
114
-
115
-
116
-
117
-
118
-
119
-
120
-
121
-
122
-
123
-
124
-
125
-
126
-
127
-
128
-
129
-
130
-
131
-
132
-
133
-
134
-
135
-
136
-
137
-
138
-
139
-
140
-
141
-
142
-
143
-
144
-
145
-
146
-
147
-
148
-
149
-
150
-
151
-
152
-
153
-
154
-
155
-
156
-
157
-
158
-
159
-
160
-
161
-
162
-
163
-
164
-
165
-
166
-
167
-
168
-
169
-
170
-
171
-
172
-
173
 |
 |

Table of Contents
Comparison of Fiscal 2011 and 2010
Operating Revenues
Operating Revenues —Our operating revenues totaled $306.3 million in fiscal 2011, an increase of $30.9 million, or 11.2%, from
$275.4 million seen in fiscal 2010. Service fees represented approximately 77.6% of our revenue for fiscal 2011 with the balance of our
revenue consisting of interchange fees. Service fee revenue increased $21.8 million, or 10.1%, from $215.8 million in fiscal 2010 to
$237.6 million in fiscal 2011. This year-over-year increase in service fee revenue was substantially driven by the increase in direct deposit
accounts (cardholders with direct deposit generally initiate more transactions and generate more revenues for us than those that do not take
advantage of this feature) and, to a lesser extent, the expansion of product features across our direct deposit customer base.
Interchange revenue represented approximately 22.4% of our revenue for fiscal 2011 and 21.6% of our revenue for fiscal 2010.
Interchange revenue increased $9.0 million, or 15.1%, from $59.6 million in fiscal 2010 to $68.6 million in fiscal 2011. This increase was
primarily the result of a 14.3% year-over-year increase in our gross dollar volume, combined with more favorable rates on some of our
interchange revenue contracts negotiated during the later part of 2010.
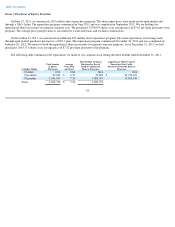
Our total operating revenues of $306.3 million in fiscal 2011 was comprised of $305.1 million related to our GPR cards and the remaining
$1.2 million related to our gift cards. Our GPR card related revenues increased by $36.0 million, or 13.4%, from fiscal 2010. Our gift card
related revenues decreased by $5.1 million, or 81.0%, from fiscal 2010 as we ceased marketing gift cards in August 2010.
38
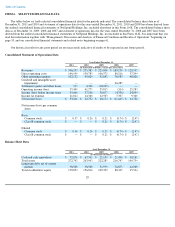
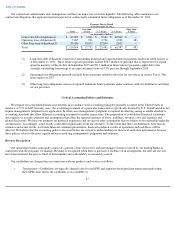
As a Percentage of Total
Operating Revenues
Year Ended December 31,
2011 2010 2009
Operating Revenues
100.0
%
100.0
%
100.0
%
Operating Expenses
Direct operating costs
47.7
47.5
47.4
Salaries, benefits and other personnel costs
17.2
19.6
20.7
Advertising, marketing and promotion costs
4.7
5.1
6.1
Other general and administrative costs
6.6
6.6
9.8
Depreciation and amortization
4.9
4.6
4.6
Settlement (gains) and other losses
0.2
1.6
(4.5
)
Total operating expenses
81.3
85.0
84.1
Operating income
18.7
15.0
15.9
Other Income (Expense)
Interest income
0.1
—
—
Interest expense
(0.8
)
(1.3
)
(2.3
)
Loss on extinguishment of debt
—
(
0.2
)
—
Total other expense
(0.7
)
(1.5
)
(2.3
)
Income before income taxes
18.0
13.5
13.6
Provision for income taxes
7.1
5.2
5.5
Net income
10.9
%
8.3
%
8.1
%