NetSpend 2011 Annual Report Download - page 97
Download and view the complete annual report
Please find page 97 of the 2011 NetSpend annual report below. You can navigate through the pages in the report by either clicking on the pages listed below, or by using the keyword search tool below to find specific information within the annual report.-
 1
1 -
2
-
3
-
4
-
5
-
6
-
7
-
8
-
9
-
10
-
11
-
12
-
13
-
14
-
15
-
16
-
17
-
18
-
19
-
20
-
21
-
22
-
23
-
24
-
25
-
26
-
27
-
28
-
29
-
30
-
31
-
32
-
33
-
34
-
35
-
36
-
37
-
38
-
39
-
40
-
41
-
42
-
43
-
44
-
45
-
46
-
47
-
48
-
49
-
50
-
51
-
52
-
53
-
54
-
55
-
56
-
57
-
58
-
59
-
60
-
61
-
62
-
63
-
64
-
65
-
66
-
67
-
68
-
69
-
70
-
71
-
72
-
73
-
74
-
75
-
76
-
77
-
78
-
79
-
80
-
81
-
82
-
83
-
84
-
85
-
86
-
 87
87 -
 88
88 -
 89
89 -
 90
90 -
 91
91 -
 92
92 -
 93
93 -
 94
94 -
 95
95 -
 96
96 -
 97
97 -
 98
98 -
 99
99 -
 100
100 -
 101
101 -
 102
102 -
 103
103 -
 104
104 -
 105
105 -
 106
106 -
 107
107 -
108
-
109
-
110
-
111
-
112
-
113
-
114
-
115
-
116
-
117
-
118
-
119
-
120
-
121
-
122
-
123
-
124
-
125
-
126
-
127
-
128
-
129
-
130
-
131
-
132
-
133
-
134
-
135
-
136
-
137
-
138
-
139
-
140
-
141
-
142
-
143
-
144
-
145
-
146
-
147
-
148
-
149
-
150
-
151
-
152
-
153
-
154
-
155
-
156
-
157
-
158
-
159
-
160
-
161
-
162
-
163
-
164
-
165
-
166
-
167
-
168
-
169
-
170
-
171
-
172
-
173
 |
 |

Table of Contents
NetSpend Holdings, Inc.
Notes to Consolidated Financial Statements (Continued)
December 31, 2011, 2010 and 2009
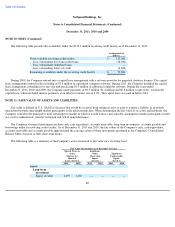
NOTE 13: SHARE BASED PAYMENT (Continued)
Assumptions for Estimating Fair Value of Stock Option Grants
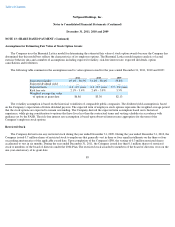
The Company uses the Binomial Lattice model for determining the estimated fair value of stock option awards because the Company has
determined that this model best reflects the characteristics of its employee options. The Binomial Lattice model requires analysis of actual
exercise behavior data and a number of assumptions including expected volatility, risk-free interest rate, expected dividends, option
cancellations and forfeitures.
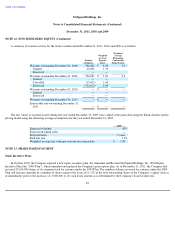
The following table summarizes the assumptions used to value options issued for the years ended December 31, 2011, 2010 and 2009:
The volatility assumption is based on the historical volatilities of comparable public companies. The dividend yield assumption is based
on the Company's expectation of future dividend payouts. The expected term of employee stock options represents the weighted average period
that the stock options are expected to remain outstanding. The Company derived the expected term assumption based on its historical
experience, while giving consideration to options that have lives less than the contractual terms and vesting schedules in accordance with
guidance set by the FASB. The risk-free interest rate assumption is based upon observed interest rates appropriate for the term of the
Company's employee stock options.
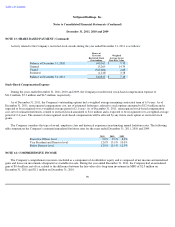
Restricted Stock
The Company did not issue any restricted stock during the year ended December 31, 2009. During the year ended December 31, 2010, the
Company issued 0.7 million shares of restricted stock to employees that generally vest in three or four equal installments on the three or four
succeeding anniversaries of the applicable award date. Upon completion of the Company's IPO, the vesting of 0.3 million restricted shares
accelerated to vest in six months. During the year ended December 31, 2011, the Company issued less than 0.1 million shares of restricted
stock to members of the board of directors under the 2004 Plan. The restricted stock awarded to members of the board of directors vests on the
one year anniversary of its grant date.
89
2011 2010 2009
Expected volatility
49.1%
-
56.5%
51.2%
-
58.4%
59.8%
Expected dividend yield
—
—
—
Expected term
6.0
-
6.9 years
6.0
-
8.5 years
7.7
-
9.4 years
Risk free rate
2.1%
-
3.4%
2.6%
-
3.8%
3.3%
Weighted average fair value
of options at grant date
$6.86
$3.30
$2.13