NetSpend 2011 Annual Report Download - page 98
Download and view the complete annual report
Please find page 98 of the 2011 NetSpend annual report below. You can navigate through the pages in the report by either clicking on the pages listed below, or by using the keyword search tool below to find specific information within the annual report.-
 1
1 -
2
-
3
-
4
-
5
-
6
-
7
-
8
-
9
-
10
-
11
-
12
-
13
-
14
-
15
-
16
-
17
-
18
-
19
-
20
-
21
-
22
-
23
-
24
-
25
-
26
-
27
-
28
-
29
-
30
-
31
-
32
-
33
-
34
-
35
-
36
-
37
-
38
-
39
-
40
-
41
-
42
-
43
-
44
-
45
-
46
-
47
-
48
-
49
-
50
-
51
-
52
-
53
-
54
-
55
-
56
-
57
-
58
-
59
-
60
-
61
-
62
-
63
-
64
-
65
-
66
-
67
-
68
-
69
-
70
-
71
-
72
-
73
-
74
-
75
-
76
-
77
-
78
-
79
-
80
-
81
-
82
-
83
-
84
-
85
-
86
-
87
-
 88
88 -
 89
89 -
 90
90 -
 91
91 -
 92
92 -
 93
93 -
 94
94 -
 95
95 -
 96
96 -
 97
97 -
 98
98 -
 99
99 -
 100
100 -
 101
101 -
 102
102 -
 103
103 -
 104
104 -
 105
105 -
 106
106 -
 107
107 -
 108
108 -
109
-
110
-
111
-
112
-
113
-
114
-
115
-
116
-
117
-
118
-
119
-
120
-
121
-
122
-
123
-
124
-
125
-
126
-
127
-
128
-
129
-
130
-
131
-
132
-
133
-
134
-
135
-
136
-
137
-
138
-
139
-
140
-
141
-
142
-
143
-
144
-
145
-
146
-
147
-
148
-
149
-
150
-
151
-
152
-
153
-
154
-
155
-
156
-
157
-
158
-
159
-
160
-
161
-
162
-
163
-
164
-
165
-
166
-
167
-
168
-
169
-
170
-
171
-
172
-
173
 |
 |

Table of Contents
NetSpend Holdings, Inc.
Notes to Consolidated Financial Statements (Continued)
December 31, 2011, 2010 and 2009
NOTE 13: SHARE BASED PAYMENT (Continued)
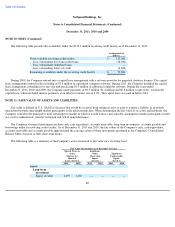
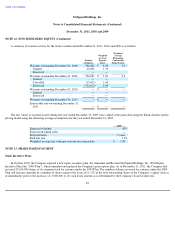
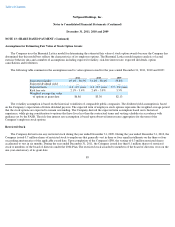
Activity related to the Company's restricted stock awards during the year ended December 31, 2011 is as follows:
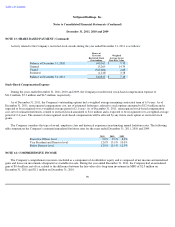
Stock-Based Compensation Expense
During the years ended December 31, 2011, 2010 and 2009, the Company recorded total stock-based compensation expense of
$11.2 million, $7.3 million and $4.5 million, respectively.
As of December 31, 2011, the Company's outstanding options had a weighted average remaining contractual term of 6.9 years. As of
December 31, 2011, unrecognized compensation cost, net of estimated forfeitures, related to stock options amounted to $12.9 million and is
expected to be recognized over a weighted average period of 2.1 years. As of December 31, 2011, unrecognized stock-based compensation
cost, net of estimated forfeitures, related to restricted stock amounted to $1.6 million and is expected to be recognized over a weighted average
period of 2.4 years. The amount of unrecognized stock-based compensation will be affected by any future stock option or restricted stock
grants.
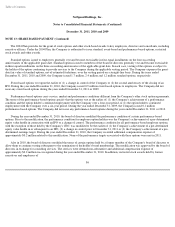
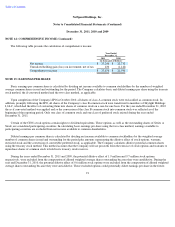
The Company considers the type of award, employee class and historical experience in estimating annual forfeiture rates. The following
table summarizes the Company's estimated annualized forfeiture rates for the years ended December 31, 2011, 2010 and 2009:
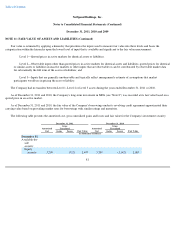
NOTE 14: COMPREHENSIVE INCOME
The Company's comprehensive income is included as a component of stockholders' equity and is composed of net income and unrealized
gains and losses on investments designated as available-for-sale. During the year ended December 31, 2011, the Company had an unrealized
gain of $0.4 million, net of tax, related to the difference between the fair value of its long-term investment in MFG of $2.5 million on
December 31, 2011 and $2.1 million on December 31, 2010.
90
Shares of
Unvested
Restricted Stock
Outstanding
Weighted
Average Grant
Date Fair Value
Balance at December 31, 2010
690,363
$
5.70
Granted
15,269
14.74
Vested
(363,606
)
4.68
Forfeited
(1,213
)
3.78
Balance at December 31, 2011
340,813
$
7.18
2011 2010 2009
Executive Officer level
9.0
%
9.0
%
8.0
%
Vice President and Director level
12.0
%
15.0
%
10.0
%
Below Director level
12.0
%
12.5
%
12.5
%