NetSpend 2011 Annual Report Download - page 39
Download and view the complete annual report
Please find page 39 of the 2011 NetSpend annual report below. You can navigate through the pages in the report by either clicking on the pages listed below, or by using the keyword search tool below to find specific information within the annual report.-
 1
1 -
2
-
3
-
4
-
5
-
6
-
7
-
8
-
9
-
10
-
11
-
12
-
13
-
14
-
15
-
16
-
17
-
18
-
19
-
20
-
21
-
22
-
23
-
24
-
25
-
26
-
27
-
28
-
 29
29 -
 30
30 -
 31
31 -
 32
32 -
 33
33 -
 34
34 -
 35
35 -
 36
36 -
 37
37 -
 38
38 -
 39
39 -
 40
40 -
 41
41 -
 42
42 -
 43
43 -
 44
44 -
 45
45 -
 46
46 -
 47
47 -
 48
48 -
 49
49 -
50
-
51
-
52
-
53
-
54
-
55
-
56
-
57
-
58
-
59
-
60
-
61
-
62
-
63
-
64
-
65
-
66
-
67
-
68
-
69
-
70
-
71
-
72
-
73
-
74
-
75
-
76
-
77
-
78
-
79
-
80
-
81
-
82
-
83
-
84
-
85
-
86
-
87
-
88
-
89
-
90
-
91
-
92
-
93
-
94
-
95
-
96
-
97
-
98
-
99
-
100
-
101
-
102
-
103
-
104
-
105
-
106
-
107
-
108
-
109
-
110
-
111
-
112
-
113
-
114
-
115
-
116
-
117
-
118
-
119
-
120
-
121
-
122
-
123
-
124
-
125
-
126
-
127
-
128
-
129
-
130
-
131
-
132
-
133
-
134
-
135
-
136
-
137
-
138
-
139
-
140
-
141
-
142
-
143
-
144
-
145
-
146
-
147
-
148
-
149
-
150
-
151
-
152
-
153
-
154
-
155
-
156
-
157
-
158
-
159
-
160
-
161
-
162
-
163
-
164
-
165
-
166
-
167
-
168
-
169
-
170
-
171
-
172
-
173
 |
 |

Table of Contents
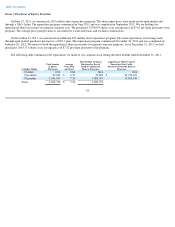
Number of Active Cards with Direct Deposit —represents the number of our active cards that have had a direct deposit load within three
months of the date of determination. We had 865,000, 719,000 and 515,000 direct deposit active cards as of December 31, 2011, 2010 and
2009, respectively. Our strategy is to focus on increasing the number of cards that receive direct deposits because cardholders who use direct
deposit generate more revenue for us than those who do not. Additionally, consumers who receive direct deposits tend to remain in our
programs longer than non-direct deposit cardholders.
Percentage of Active Cards with Direct Deposit —represents the percentage of our active GPR cards that have had a direct deposit load
within three months of the date of determination. The percentage of our active cards that were direct deposit active cards as of December 31,
2011, 2010 and 2009, was 41%, 34% and 27%, respectively.
Gross Dollar Volume (GDV) —represents the total dollar volume of debit transactions and cash withdrawals made using our GPR cards.
Our gross dollar volume was $11.2 billion, $9.8 billion and $7.6 billion for the years ended December 31, 2011, 2010 and 2009, respectively.
Approximately 78.0%, 71.8% and 64.4% of the gross dollar volume for the years ended December 31, 2011, 2010 and 2009, respectively, was
made using active cards with direct deposit.
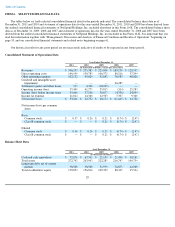
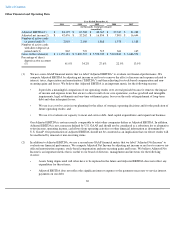
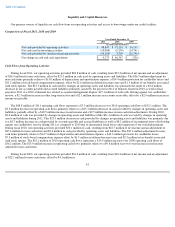
Key Components of Our Results of Operations
Operating Revenues
Our operating revenues principally consist of a portion of the service fees and interchange revenues received by our Issuing Banks in
connection with the programs we manage.
Cardholders are charged fees in connection with our products and services, as follows:
• Transactions—Cardholders are typically charged a fee for each PIN and signature-based purchase transaction made using
their GPR cards, unless the cardholder is on a monthly or annual service plan, in which case the cardholder is instead charged a
monthly or annual subscription fee, as applicable. Cardholders are also charged fees for ATM withdrawals and other
transactions conducted at ATMs.
• Customer Service and Maintenance—
Cardholders are typically charged fees for balance inquiries made through our call centers.
Cardholders are also charged a monthly maintenance fee after a specified period of inactivity.
• Additional Products and Services—Cardholders are charged fees associated with additional products and services offered in
connection with certain of our GPR cards, including the use of overdraft features, a variety of bill payment options, custom card
designs and card-to-card transfers of funds initiated through our call centers.
• Other—Cardholders are charged fees in connection with the acquisition and reloading of our GPR cards at retailers and we
receive a portion of these amounts in some cases.
Revenue resulting from the service fees charged to our cardholders described above is recognized when the fees are charged because the
earnings process is substantially complete, except for revenue resulting from the initial activation of our cards and annual subscription fees.
Revenue resulting from the initial activation of our cards is recognized ratably, net of commissions paid to our distributors, over the average
account life, which is approximately one year for our GPR cards (three months for the gift cards we marketed prior to August 2010). Revenue
resulting from annual subscription fees is recognized ratably over the annual period to which the fees relate.
Our revenues also include fees charged in connection with program management and processing services we provide for private-label
programs, as well as fees charged to MetaBank based on interest earned on cardholder funds. Under our current arrangement with MetaBank,
we would only be entitled
35