NetSpend 2011 Annual Report Download - page 43
Download and view the complete annual report
Please find page 43 of the 2011 NetSpend annual report below. You can navigate through the pages in the report by either clicking on the pages listed below, or by using the keyword search tool below to find specific information within the annual report.-
 1
1 -
2
-
3
-
4
-
5
-
6
-
7
-
8
-
9
-
10
-
11
-
12
-
13
-
14
-
15
-
16
-
17
-
18
-
19
-
20
-
21
-
22
-
23
-
24
-
25
-
26
-
27
-
28
-
29
-
30
-
31
-
32
-
 33
33 -
 34
34 -
 35
35 -
 36
36 -
 37
37 -
 38
38 -
 39
39 -
 40
40 -
 41
41 -
 42
42 -
 43
43 -
 44
44 -
 45
45 -
 46
46 -
 47
47 -
 48
48 -
 49
49 -
 50
50 -
 51
51 -
 52
52 -
 53
53 -
54
-
55
-
56
-
57
-
58
-
59
-
60
-
61
-
62
-
63
-
64
-
65
-
66
-
67
-
68
-
69
-
70
-
71
-
72
-
73
-
74
-
75
-
76
-
77
-
78
-
79
-
80
-
81
-
82
-
83
-
84
-
85
-
86
-
87
-
88
-
89
-
90
-
91
-
92
-
93
-
94
-
95
-
96
-
97
-
98
-
99
-
100
-
101
-
102
-
103
-
104
-
105
-
106
-
107
-
108
-
109
-
110
-
111
-
112
-
113
-
114
-
115
-
116
-
117
-
118
-
119
-
120
-
121
-
122
-
123
-
124
-
125
-
126
-
127
-
128
-
129
-
130
-
131
-
132
-
133
-
134
-
135
-
136
-
137
-
138
-
139
-
140
-
141
-
142
-
143
-
144
-
145
-
146
-
147
-
148
-
149
-
150
-
151
-
152
-
153
-
154
-
155
-
156
-
157
-
158
-
159
-
160
-
161
-
162
-
163
-
164
-
165
-
166
-
167
-
168
-
169
-
170
-
171
-
172
-
173
 |
 |

Table of Contents
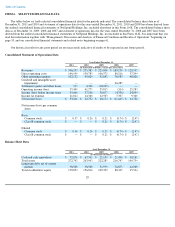
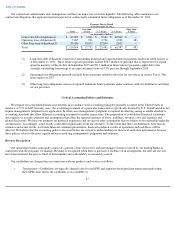
Operating Expenses
The following table presents the breakdown of operating expenses among direct operating costs, personnel costs, advertising and
marketing costs, other general and administrative costs, depreciation and amortization and other components of operating expenses:
Direct Operating Costs —Our direct operating costs were $146.2 million in fiscal 2011, an increase of $15.4 million, or 11.8%, from
fiscal 2010. As a percentage of revenues, our direct operating costs increased from 47.5% in fiscal 2010 to 47.7% in fiscal 2011. These
increases were primarily due to an increase in our provision for fraud-related losses, increased overdraft defaults and an increase in
commissions we paid to our distributors because ACE, our largest distribution partner, reached their maximum commission tier more often in
2011 due to increasing volumes. We also saw an increase in ATM processing fees resulting from an increase in the number of ATM
transactions by our cardholders. Partially offsetting these increases was a decline in call center costs as a result of greater efficiencies of scale
from our back office systems as well as cost savings achieved on some of our outsourced call center contracts negotiated in late 2010.
Salaries, Benefits and Other Personnel Costs —Our salaries, benefits and other personnel costs were $52.7 million in fiscal 2011, a
decrease of $1.3 million, or 2.4%, from fiscal 2010. This year-over-year change reflects a $4.5 million decrease in bonus expense as we
significantly exceeded our performance targets in 2010 but were somewhat below our 2011 targets, offset by a $4.0 million increase in stock-
based compensation expense as a result of awards issued in 2010 and 2011 and the accelerated vesting of previously issued equity awards
following the completion of our initial public offering in October 2010. In addition, we also saw an increase in capitalized personnel costs
(which has the effect of reducing salaries, benefits and other personnel costs) for internally developed fixed assets in connection with the
consolidation of some of our processing platforms and call center activities.
Advertising, Marketing and Promotion Costs —Our advertising, marketing and promotion costs were $14.2 million in fiscal 2011, which
was relatively consistent with the $14.0 spent in fiscal 2010. We expect these costs to increase as a percentage of revenue as we increase our
investment in direct-to-consumer marketing such as internet, television, radio and direct mail advertising.
Other General and Administrative Costs —Our other general and administrative costs were $20.1 million in fiscal 2011, an increase of
$1.9 million, or 10.4%, from fiscal 2010. This year-over-year increase was primarily the result of an increase in legal and other professional
expenses, insurance costs and other corporate expenses related to our current status as a public reporting company. We were a private company
during the first nine months of 2010. In addition, we incurred greater software
39
Year Ended December 31,
2011 2010
Amount
Percentage of
Total
Operating
Revenues Amount
Percentage of
Total
Operating
Revenues Change
(in thousands of dollars)
Operating Expenses
Direct operating costs
$
146,199
47.7
%
$
130,783
47.5
%
$
15,416
Salaries, benefits and other
personnel costs
52,736
17.2
54,032
19.6
(1,296
)
Advertising, marketing and
promotion costs
14,230
4.7
14,038
5.1
192
Other general and
administrative costs
20,135
6.6
18,234
6.6
1,901
Depreciation and amortization
15,031
4.9
12,725
4.6
2,306
Settlements and other losses
515
0.2
4,300
1.6
(3,785
)
Total operating expenses
$
248,846
81.3
%
$
234,112
85.0
%
$
14,734