NetSpend 2011 Annual Report Download - page 71
Download and view the complete annual report
Please find page 71 of the 2011 NetSpend annual report below. You can navigate through the pages in the report by either clicking on the pages listed below, or by using the keyword search tool below to find specific information within the annual report.-
 1
1 -
2
-
3
-
4
-
5
-
6
-
7
-
8
-
9
-
10
-
11
-
12
-
13
-
14
-
15
-
16
-
17
-
18
-
19
-
20
-
21
-
22
-
23
-
24
-
25
-
26
-
27
-
28
-
29
-
30
-
31
-
32
-
33
-
34
-
35
-
36
-
37
-
38
-
39
-
40
-
41
-
42
-
43
-
44
-
45
-
46
-
47
-
48
-
49
-
50
-
51
-
52
-
53
-
54
-
55
-
56
-
57
-
58
-
59
-
60
-
 61
61 -
 62
62 -
 63
63 -
 64
64 -
 65
65 -
 66
66 -
 67
67 -
 68
68 -
 69
69 -
 70
70 -
 71
71 -
 72
72 -
 73
73 -
 74
74 -
 75
75 -
 76
76 -
 77
77 -
 78
78 -
 79
79 -
 80
80 -
 81
81 -
82
-
83
-
84
-
85
-
86
-
87
-
88
-
89
-
90
-
91
-
92
-
93
-
94
-
95
-
96
-
97
-
98
-
99
-
100
-
101
-
102
-
103
-
104
-
105
-
106
-
107
-
108
-
109
-
110
-
111
-
112
-
113
-
114
-
115
-
116
-
117
-
118
-
119
-
120
-
121
-
122
-
123
-
124
-
125
-
126
-
127
-
128
-
129
-
130
-
131
-
132
-
133
-
134
-
135
-
136
-
137
-
138
-
139
-
140
-
141
-
142
-
143
-
144
-
145
-
146
-
147
-
148
-
149
-
150
-
151
-
152
-
153
-
154
-
155
-
156
-
157
-
158
-
159
-
160
-
161
-
162
-
163
-
164
-
165
-
166
-
167
-
168
-
169
-
170
-
171
-
172
-
173
 |
 |

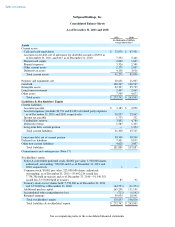
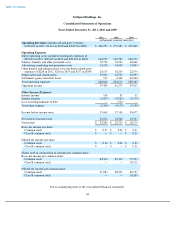
Table of Contents
NetSpend Holdings, Inc.
Consolidated Statements of Operations
Years Ended December 31, 2011, 2010 and 2009
See accompanying notes to the consolidated financial statements.
64
2011 2010 2009
(in thousands, except per share data)
Operating Revenues
(includes related party revenues
of $5,401 in 2011, $4,611 in 2010 and $2,897 in 2009)
$
306,255
$
275,387
$
225,000
Operating Expenses
Direct operating costs (includes related party expenses of
$49,812 in 2011, $38,625 in 2010 and $28,903 in 2009)
146,199
130,783
106,572
Salaries, benefits and other personnel costs
52,736
54,032
46,668
Advertising, marketing and promotion costs
14,230
14,038
13,803
Other general and administrative costs (includes related party
expenses of $226 in 2011, $210 in 2010 and $157 in 2009)
20,135
18,234
22,074
Depreciation and amortization
15,031
12,725
10,297
Settlement (gains) and other losses
515
4,300
(10,229
)
Total operating expenses
248,846
234,112
189,185
Operating income
57,409
41,275
35,815
Other Income (Expense)
Interest income
108
85
32
Interest expense
(2,457
)
(3,526
)
(5,170
)
Loss on extinguishment of debt
—
(
734
)
—
Total other expense
(2,349
)
(4,175
)
(5,138
)
Income before income taxes
55,060
37,100
30,677
Provision for income taxes
21,814
14,368
12,503
Net income
$
33,246
$
22,732
$
18,174
Basic net income per share:
Common stock
$
0.37
$
0.26
$
0.21
Class B common stock
$
—
$
—
$
0.21
Diluted net income per share:
Common stock
$
0.36
$
0.26
$
0.21
Class B common stock
$
—
$
—
$
0.21
Shares used in computation of earnings per common share
Basic net income per common share:
Common stock
84,504
85,394
75,543
Class B common stock
—
—
10,112
Diluted net income per common share:
Common stock
91,284
88,991
86,733
Class B common stock
—
—
10,205