NetSpend 2011 Annual Report Download - page 100
Download and view the complete annual report
Please find page 100 of the 2011 NetSpend annual report below. You can navigate through the pages in the report by either clicking on the pages listed below, or by using the keyword search tool below to find specific information within the annual report.-
 1
1 -
2
-
3
-
4
-
5
-
6
-
7
-
8
-
9
-
10
-
11
-
12
-
13
-
14
-
15
-
16
-
17
-
18
-
19
-
20
-
21
-
22
-
23
-
24
-
25
-
26
-
27
-
28
-
29
-
30
-
31
-
32
-
33
-
34
-
35
-
36
-
37
-
38
-
39
-
40
-
41
-
42
-
43
-
44
-
45
-
46
-
47
-
48
-
49
-
50
-
51
-
52
-
53
-
54
-
55
-
56
-
57
-
58
-
59
-
60
-
61
-
62
-
63
-
64
-
65
-
66
-
67
-
68
-
69
-
70
-
71
-
72
-
73
-
74
-
75
-
76
-
77
-
78
-
79
-
80
-
81
-
82
-
83
-
84
-
85
-
86
-
87
-
88
-
89
-
 90
90 -
 91
91 -
 92
92 -
 93
93 -
 94
94 -
 95
95 -
 96
96 -
 97
97 -
 98
98 -
 99
99 -
 100
100 -
 101
101 -
 102
102 -
 103
103 -
 104
104 -
 105
105 -
 106
106 -
 107
107 -
 108
108 -
 109
109 -
 110
110 -
111
-
112
-
113
-
114
-
115
-
116
-
117
-
118
-
119
-
120
-
121
-
122
-
123
-
124
-
125
-
126
-
127
-
128
-
129
-
130
-
131
-
132
-
133
-
134
-
135
-
136
-
137
-
138
-
139
-
140
-
141
-
142
-
143
-
144
-
145
-
146
-
147
-
148
-
149
-
150
-
151
-
152
-
153
-
154
-
155
-
156
-
157
-
158
-
159
-
160
-
161
-
162
-
163
-
164
-
165
-
166
-
167
-
168
-
169
-
170
-
171
-
172
-
173
 |
 |

Table of Contents
NetSpend Holdings, Inc.
Notes to Consolidated Financial Statements (Continued)
December 31, 2011, 2010 and 2009
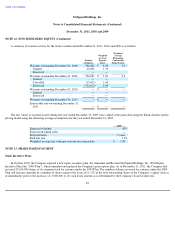
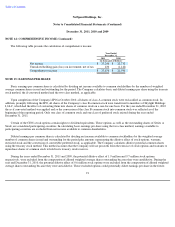
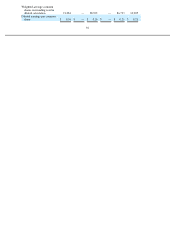
NOTE 15: EARNINGS PER SHARE (Continued)
The following is a reconciliation of the numerator (net income) and the denominator (weighted average number of common shares) used
in the calculation of basic and diluted earnings per share for the years ended December 31, 2011, 2010 and 2009:
Years Ended December 31,
2011 2010 2009
Common
Stock
Class B
Common
Stock Common
Stock
Class B
Common
Stock Common
Stock
Class B
Common
Stock
(in thousands of dollars, except share and per share data)
Basic earnings per common
share:
Net income
$
33,246
$
—
$
22,732
$
—
$
16,028
$
2,146
Less: Earnings distributed to
participating securities
(353
)
—
(
176
)
—
(
188
)
(25
)
Less: Undistributed earnings
allocated to participating
securities
(1,505
)
—
(
311
)
—
(
68
)
(10
)
Undistributed earnings
available to common
stockholders
$
31,388
$
—
$
22,245
$
—
$
15,772
$
2,111
Weighted-average common
shares outstanding used in
basic calculation
84,504
—
85,394
—
75,543
10,112
Basic earnings per common
share
$
0.37
$
—
$
0.26
$
—
$
0.21
$
0.21
Diluted earnings per
common share:
Undistributed earnings
available to common
stockholders
$
31,388
$
—
$
22,245
$
—
$
15,772
$
2,111
Add: Earnings distributed to
participating securities
353
—
176
—
213
—
Add: Undistributed earnings
allocated to participating
securities
1,505
—
311
—
78
—
Add: Reallocation of
undistributed earnings as a
result of conversion of
class B to common stock
—
—
—
—
2,111
—
Add: Reallocation of
undistributed earnings to
class B shares
—
—
—
—
—
27
Net income
$
33,246
$
—
$
22,732
$
—
$
18,174
$
2,138
Weighted-average common
shares outstanding used in
basic calculation
84,504
—
85,394
—
75,543
10,112
Weighted-average effect of
dilutive securities:
Conversion of class B to
common stock
—
—
—
—
10,112
—
Conversion of preferred
stock to common stock
2,608
—
—
—
—
—
Options
3,985
—
3,045
—
615
—
Warrants
—
—
384
—
370
—
Restricted stock
187
—
168
—
93
93