NetSpend 2011 Annual Report Download - page 48
Download and view the complete annual report
Please find page 48 of the 2011 NetSpend annual report below. You can navigate through the pages in the report by either clicking on the pages listed below, or by using the keyword search tool below to find specific information within the annual report.-
 1
1 -
2
-
3
-
4
-
5
-
6
-
7
-
8
-
9
-
10
-
11
-
12
-
13
-
14
-
15
-
16
-
17
-
18
-
19
-
20
-
21
-
22
-
23
-
24
-
25
-
26
-
27
-
28
-
29
-
30
-
31
-
32
-
33
-
34
-
35
-
36
-
37
-
 38
38 -
 39
39 -
 40
40 -
 41
41 -
 42
42 -
 43
43 -
 44
44 -
 45
45 -
 46
46 -
 47
47 -
 48
48 -
 49
49 -
 50
50 -
 51
51 -
 52
52 -
 53
53 -
 54
54 -
 55
55 -
 56
56 -
 57
57 -
 58
58 -
59
-
60
-
61
-
62
-
63
-
64
-
65
-
66
-
67
-
68
-
69
-
70
-
71
-
72
-
73
-
74
-
75
-
76
-
77
-
78
-
79
-
80
-
81
-
82
-
83
-
84
-
85
-
86
-
87
-
88
-
89
-
90
-
91
-
92
-
93
-
94
-
95
-
96
-
97
-
98
-
99
-
100
-
101
-
102
-
103
-
104
-
105
-
106
-
107
-
108
-
109
-
110
-
111
-
112
-
113
-
114
-
115
-
116
-
117
-
118
-
119
-
120
-
121
-
122
-
123
-
124
-
125
-
126
-
127
-
128
-
129
-
130
-
131
-
132
-
133
-
134
-
135
-
136
-
137
-
138
-
139
-
140
-
141
-
142
-
143
-
144
-
145
-
146
-
147
-
148
-
149
-
150
-
151
-
152
-
153
-
154
-
155
-
156
-
157
-
158
-
159
-
160
-
161
-
162
-
163
-
164
-
165
-
166
-
167
-
168
-
169
-
170
-
171
-
172
-
173
 |
 |

Table of Contents
cash used by operating assets and liabilities. The $22.1 million adjustment for non-cash items primarily relates to $10.3 million of depreciation
and amortization expense, $4.9 million of provision for cardholder losses, $4.5 million of stock-based compensation expense and $3.1 million
in deferred income taxes. These items were offset by a $1.2 million non-cash legal settlement gain.
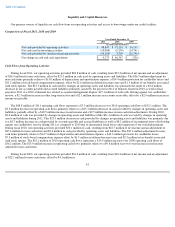
Cash Flows from Investing Activities
Investing activities used $10.1 million of cash in fiscal 2011, primarily for purchases of property and equipment ($9.2 million) and
premiums paid on the life insurance policies issued to support our obligations under our deferred compensation plan ($0.9 million). Investing
activities used $9.3 million of cash in fiscal 2010, which related primarily to $6.0 million of purchases of property and equipment and a
$3.2 million long-term investment in Meta Financial Group, Inc., the holding company for one of our Issuing Banks. Investing activities used
$14.7 million of cash in fiscal 2009, $14.6 million of which was used to purchase property and equipment.
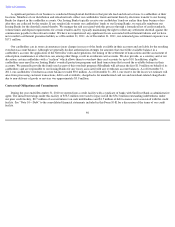
Cash Flows from Financing Activities
Financing activities used $34.2 million of cash in fiscal 2011, primarily to repurchase outstanding shares of common stock ($32.7 million)
and for payments under a capital lease ($3.3 million). These cash outflows were partially offset by $1.5 million of tax benefits associated with
stock options and $1.4 million of cash received upon the exercise of stock options.
Financing activities provided $3.5 million of cash in fiscal 2010, primarily related to $21.0 million in proceeds, net of offering costs, from
our initial public offering in October 2010, a $2.5 million income tax benefit associated with stock options and $0.9 million of cash received
upon the exercise of stock options and warrants. These proceeds were partially offset by $6.5 million in scheduled debt payments and a
$9.0 million revolving debt payment. In September 2010 we entered into a new credit facility. The initial borrowings under this new credit
facility of $58.5 million were used to repay in full the remaining $56.3 million outstanding indebtedness under our prior credit facility,
$0.7 million of accrued interest and $1.5 million of debt issuance costs associated with the new credit facility. The remainder of the cash used
in financing activities for fiscal 2010 was comprised primarily of a $5.7 million repurchase of common stock.
Financing activities used $21.8 million of cash in fiscal 2009. The $21.8 million of cash outflows primarily related to $25.5 million in
debt-related payments, which included $25.1 million of principal payments and $0.4 million of debt issuance costs. The $25.5 million of debt-
related payments was partially offset by a $9.0 million draw on our prior revolving credit facility during 2009. Financing cash flows in 2009
also included a $5.0 million cash outflow related to payment of the remaining portion of a $30.0 million dividend declared in 2008.
Sources of Financing
Since the inception of NetSpend Holdings in February 2004, we have primarily financed our operations through cash flows from
operations, debt financing and the net proceeds received from our initial public offering in October 2010. We believe that our existing cash
balances, together with the amounts we expect to generate from operations and the amounts available through our revolving credit facility will
be sufficient to meet our operating needs for the next twelve months, including working capital requirements, capital expenditures and debt
repayment obligations.
44