NetSpend 2011 Annual Report Download - page 74
Download and view the complete annual report
Please find page 74 of the 2011 NetSpend annual report below. You can navigate through the pages in the report by either clicking on the pages listed below, or by using the keyword search tool below to find specific information within the annual report.-
 1
1 -
2
-
3
-
4
-
5
-
6
-
7
-
8
-
9
-
10
-
11
-
12
-
13
-
14
-
15
-
16
-
17
-
18
-
19
-
20
-
21
-
22
-
23
-
24
-
25
-
26
-
27
-
28
-
29
-
30
-
31
-
32
-
33
-
34
-
35
-
36
-
37
-
38
-
39
-
40
-
41
-
42
-
43
-
44
-
45
-
46
-
47
-
48
-
49
-
50
-
51
-
52
-
53
-
54
-
55
-
56
-
57
-
58
-
59
-
60
-
61
-
62
-
63
-
 64
64 -
 65
65 -
 66
66 -
 67
67 -
 68
68 -
 69
69 -
 70
70 -
 71
71 -
 72
72 -
 73
73 -
 74
74 -
 75
75 -
 76
76 -
 77
77 -
 78
78 -
 79
79 -
 80
80 -
 81
81 -
 82
82 -
 83
83 -
 84
84 -
85
-
86
-
87
-
88
-
89
-
90
-
91
-
92
-
93
-
94
-
95
-
96
-
97
-
98
-
99
-
100
-
101
-
102
-
103
-
104
-
105
-
106
-
107
-
108
-
109
-
110
-
111
-
112
-
113
-
114
-
115
-
116
-
117
-
118
-
119
-
120
-
121
-
122
-
123
-
124
-
125
-
126
-
127
-
128
-
129
-
130
-
131
-
132
-
133
-
134
-
135
-
136
-
137
-
138
-
139
-
140
-
141
-
142
-
143
-
144
-
145
-
146
-
147
-
148
-
149
-
150
-
151
-
152
-
153
-
154
-
155
-
156
-
157
-
158
-
159
-
160
-
161
-
162
-
163
-
164
-
165
-
166
-
167
-
168
-
169
-
170
-
171
-
172
-
173
 |
 |

Table of Contents
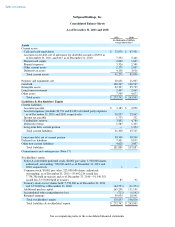
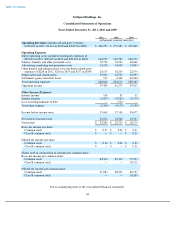
NetSpend Holdings, Inc.
Consolidated Statements of Cash Flows
Years Ended December 31, 2011, 2010 and 2009
See accompanying notes to the consolidated financial statements.
66
2011 2010 2009
(in thousands of dollars)
Cash flows from operating activities
Net income
$
33,246
$
22,732
$
18,174
Adjustments to reconcile net income to net cash provided by operating activities
Depreciation and amortization
15,031
12,725
10,297
Amortization of debt issuance costs
326
424
476
Loss on extinguishment of debt
—
734
—
Gain on settlement
—
—
(
1,192
)
Stock
-
based compensation
11,242
7,268
4,484
Tax benefit associated with stock options
(1,541
)
(2,536
)
(18
)
Provision for cardholder losses
14,441
10,254
4,930
Deferred income taxes
(2,646
)
(1,505
)
3,101
Change in cash surrender value of life insurance policies
8
—
—
Changes in operating assets and liabilities
Accounts receivable
(2,111
)
(928
)
1,037
Income tax receivable or payable
2,942
5,243
(203
)
Prepaid card supply
(395
)
178
396
Prepaid expenses
(946
)
(23
)
(654
)
Other current assets
(1,172
)
838
(826
)
Other long
-
term assets
(2,316
)
(972
)
(1,754
)
Accounts payable and accrued expenses
(3,797
)
2,942
2,291
Cardholders' reserve
(15,338
)
(7,085
)
(4,629
)
Deferred revenue
252
(825
)
212
Other liabilities
1,621
2,637
73
Net cash provided by operating activities
48,847
52,101
36,195
Cash flows from investing activities
Purchase of property and equipment
(9,182
)
(6,045
)
(14,616
)
Purchase of intangible assets
(12
)
(4
)
(125
)
Long
-
term investment
—
(
3,210
)
—
Premiums paid on cash surrender value life insurance policies
(894
)
—
—
Net cash used in investing activities
(10,088
)
(9,259
)
(14,741
)
Cash flows from financing activities
Dividends paid
—
—
(
5,000
)
Dividend equivalents paid
(353
)
(176
)
(213
)
Proceeds from exercise of common stock warrants
—
83
—
Proceeds from exercise of common stock options
1,405
851
125
Tax benefit associated with stock options
1,541
2,536
18
Net cash proceeds (disbursements) from initial public offering
(95
)
20,981
—
Proceeds from issuance of long
-
term debt
—
58,500
9,000
Issuance costs of long
-
term debt
—
(
1,462
)
(361
)
Principal payment on debt
(3,303
)
(72,138
)
(25,140
)
Treasury stock purchase
(32,718
)
(5,670
)
(219
)
Tax withholding on restricted stock
(661
)
—
—
Net cash provided by (used in) financing activities
(34,184
)
3,505
(21,790
)
Net change in cash and cash equivalents
4,575
46,347
(336
)
Cash and cash equivalents at beginning of year
67,501
21,154
21,490
Cash and cash equivalents at end of year
$
72,076
$
67,501
$
21,154
Supplemental disclosure of cash flow information
Cash paid for interest
$
2,591
$
2,764
$
4,893
Cash paid for income taxes
21,432
10,682
10,040
Non-cash investing activities
Capital lease entered into for the purchase of software
$
1,949
$
—
$
3,383