NetSpend 2011 Annual Report Download - page 89
Download and view the complete annual report
Please find page 89 of the 2011 NetSpend annual report below. You can navigate through the pages in the report by either clicking on the pages listed below, or by using the keyword search tool below to find specific information within the annual report.-
 1
1 -
2
-
3
-
4
-
5
-
6
-
7
-
8
-
9
-
10
-
11
-
12
-
13
-
14
-
15
-
16
-
17
-
18
-
19
-
20
-
21
-
22
-
23
-
24
-
25
-
26
-
27
-
28
-
29
-
30
-
31
-
32
-
33
-
34
-
35
-
36
-
37
-
38
-
39
-
40
-
41
-
42
-
43
-
44
-
45
-
46
-
47
-
48
-
49
-
50
-
51
-
52
-
53
-
54
-
55
-
56
-
57
-
58
-
59
-
60
-
61
-
62
-
63
-
64
-
65
-
66
-
67
-
68
-
69
-
70
-
71
-
72
-
73
-
74
-
75
-
76
-
77
-
78
-
 79
79 -
 80
80 -
 81
81 -
 82
82 -
 83
83 -
 84
84 -
 85
85 -
 86
86 -
 87
87 -
 88
88 -
 89
89 -
 90
90 -
 91
91 -
 92
92 -
 93
93 -
 94
94 -
 95
95 -
 96
96 -
 97
97 -
 98
98 -
 99
99 -
100
-
101
-
102
-
103
-
104
-
105
-
106
-
107
-
108
-
109
-
110
-
111
-
112
-
113
-
114
-
115
-
116
-
117
-
118
-
119
-
120
-
121
-
122
-
123
-
124
-
125
-
126
-
127
-
128
-
129
-
130
-
131
-
132
-
133
-
134
-
135
-
136
-
137
-
138
-
139
-
140
-
141
-
142
-
143
-
144
-
145
-
146
-
147
-
148
-
149
-
150
-
151
-
152
-
153
-
154
-
155
-
156
-
157
-
158
-
159
-
160
-
161
-
162
-
163
-
164
-
165
-
166
-
167
-
168
-
169
-
170
-
171
-
172
-
173
 |
 |

Table of Contents
NetSpend Holdings, Inc.
Notes to Consolidated Financial Statements (Continued)
December 31, 2011, 2010 and 2009
NOTE 11: FAIR VALUE OF ASSETS AND LIABILITIES (Continued)
Fair value is estimated by applying a hierarchy that prioritizes the inputs used to measure fair value into three levels and bases the
categorization within the hierarchy upon the lowest level of input that is available and significant to the fair value measurement:
Level 1—Quoted prices in active markets for identical assets or liabilities;
Level 2—
Observable inputs other than quoted prices in active markets for identical assets and liabilities, quoted prices for identical
or similar assets or liabilities in inactive markets or other inputs that are observable or can be corroborated by observable market data
for substantially the full term of the assets or liabilities; and
Level 3—Inputs that are generally unobservable and typically reflect management's estimate of assumptions that market
participants would use in pricing the asset or liability.
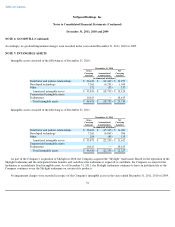
The Company had no transfers between Level 1, Level 2 or Level 3 assets during the years ended December 31, 2011 or 2010.
As of December 31, 2011 and 2010, the Company's long-term investment in MFG (see "Note 8") was recorded at its fair value based on a
quoted price in an active market.
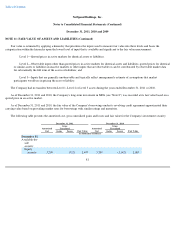
As of December 31, 2011 and 2010, the fair value of the Company's borrowings under its revolving credit agreement approximated their
carrying value based on prevailing market rates for borrowings with similar ratings and maturities.
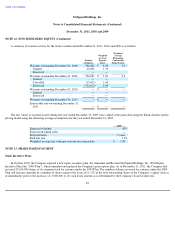
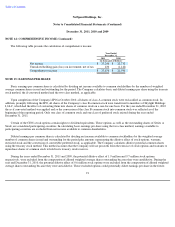
The following table presents the amortized cost, gross unrealized gains and losses and fair value for the Company's investment security:
81
December 31, 2011 December 31, 2010
Gross
Unrealized
Gross
Unrealized
Amortized
Cost
Amortized
Cost
Gains Losses Fair Value Gains Losses Fair Value
(in thousands of dollars)
December 31:
Available-for-
sale
security
Equity
security
3,209
(712
)
2,497
3,209
(1,142
)
2,067