NetSpend 2011 Annual Report Download - page 35
Download and view the complete annual report
Please find page 35 of the 2011 NetSpend annual report below. You can navigate through the pages in the report by either clicking on the pages listed below, or by using the keyword search tool below to find specific information within the annual report.-
 1
1 -
2
-
3
-
4
-
5
-
6
-
7
-
8
-
9
-
10
-
11
-
12
-
13
-
14
-
15
-
16
-
17
-
18
-
19
-
20
-
21
-
22
-
23
-
24
-
 25
25 -
 26
26 -
 27
27 -
 28
28 -
 29
29 -
 30
30 -
 31
31 -
 32
32 -
 33
33 -
 34
34 -
 35
35 -
 36
36 -
 37
37 -
 38
38 -
 39
39 -
 40
40 -
 41
41 -
 42
42 -
 43
43 -
 44
44 -
 45
45 -
46
-
47
-
48
-
49
-
50
-
51
-
52
-
53
-
54
-
55
-
56
-
57
-
58
-
59
-
60
-
61
-
62
-
63
-
64
-
65
-
66
-
67
-
68
-
69
-
70
-
71
-
72
-
73
-
74
-
75
-
76
-
77
-
78
-
79
-
80
-
81
-
82
-
83
-
84
-
85
-
86
-
87
-
88
-
89
-
90
-
91
-
92
-
93
-
94
-
95
-
96
-
97
-
98
-
99
-
100
-
101
-
102
-
103
-
104
-
105
-
106
-
107
-
108
-
109
-
110
-
111
-
112
-
113
-
114
-
115
-
116
-
117
-
118
-
119
-
120
-
121
-
122
-
123
-
124
-
125
-
126
-
127
-
128
-
129
-
130
-
131
-
132
-
133
-
134
-
135
-
136
-
137
-
138
-
139
-
140
-
141
-
142
-
143
-
144
-
145
-
146
-
147
-
148
-
149
-
150
-
151
-
152
-
153
-
154
-
155
-
156
-
157
-
158
-
159
-
160
-
161
-
162
-
163
-
164
-
165
-
166
-
167
-
168
-
169
-
170
-
171
-
172
-
173
 |
 |

Table of Contents
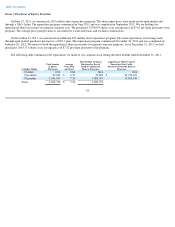
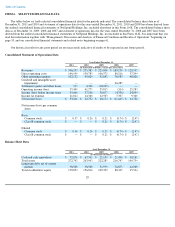
The following is a reconciliation of our net income (loss) for the years ended December 31, 2011, 2010, 2009, 2008 and 2007 to Adjusted
EBITDA.
Settlement (gains) and other losses of $0.5 million during the year ended December 31, 2011 primarily relate to severance costs
incurred in connection with the consolidation of some of our
31
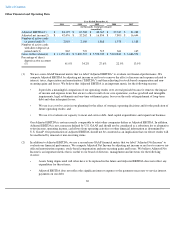
• Adjusted Net Income provides a meaningful comparison of our operating results over several periods because it
removes the impact of income and expense items that are not a direct result of our core operations, such as
goodwill and intangible impairments, legal settlements and one-time settlement gains, losses on the early
extinguishment of debt and other infrequent losses;
• Adjusted Net Income per share on a diluted basis functions as a threshold target for our company-wide employee
bonus compensation; and
• We believe Adjusted Net Income measurements are used by investors as a supplemental measure to evaluate the
overall operating performance of companies in our industry.
By providing these non-GAAP financial measures, together with the below reconciliation, we believe we are enhancing
investors' understanding of our business and our results of operations, as well as assisting investors in evaluating how
well we are executing strategic initiatives.
Our Adjusted Net Income is not necessarily comparable to what other companies define as Adjusted Net Income. In
addition, Adjusted Net Income is not a measure defined by U.S. GAAP and should not be considered as a substitute for or
alternative to net income, operating income, cash flows from operating activities or other financial information as
determined by U.S. GAAP. Our presentation of Adjusted Net Income should not be construed as an implication that our
future results will be unaffected by unusual or non-recurring items.
(3) Number of active cards represents the total number of our GPR card accounts that have had a PIN or signature-based
transaction, a load transaction at a retailer location or an ATM withdrawal within three months of the date of
determination.
(4) Gross dollar volume represents the total dollar volume of debit transactions and cash withdrawals made using our GPR
cards.
(5) Percentage of active cards with direct deposit represents the percentage of our active GPR cards that have had a direct
deposit load within three months of the date of determination.
Year Ended December 31,
2011 2010 2009 2008 2007
(in thousands of dollars)
Net income (loss)
$
33,246
$
22,732
$
18,174
$
(11,645
)
$
14,726
Interest income
(108
)
(85
)
(32
)
(384
)
(876
)
Interest expense
2,457
3,526
5,170
4,408
2,065
Income tax expense
21,814
14,368
12,503
7,307
9,368
Depreciation and amortization
15,031
12,725
10,297
8,899
5,251
EBITDA
72,440
53,266
46,112
8,585
30,534
Stock
-
based compensation expense
11,242
7,268
4,484
2,473
754
Goodwill and acquired intangible
asset impairment
—
—
—
26,285
—
Settlement (gains) and other losses
515
4,300
(10,229
)
—
—
Loss on extinguishment of debt
—
734
—
—
—
Adjusted EBITDA
$
84,197
$
65,568
$
40,367
$
37,343
$
31,288