NetSpend 2011 Annual Report Download - page 69
Download and view the complete annual report
Please find page 69 of the 2011 NetSpend annual report below. You can navigate through the pages in the report by either clicking on the pages listed below, or by using the keyword search tool below to find specific information within the annual report.-
 1
1 -
2
-
3
-
4
-
5
-
6
-
7
-
8
-
9
-
10
-
11
-
12
-
13
-
14
-
15
-
16
-
17
-
18
-
19
-
20
-
21
-
22
-
23
-
24
-
25
-
26
-
27
-
28
-
29
-
30
-
31
-
32
-
33
-
34
-
35
-
36
-
37
-
38
-
39
-
40
-
41
-
42
-
43
-
44
-
45
-
46
-
47
-
48
-
49
-
50
-
51
-
52
-
53
-
54
-
55
-
56
-
57
-
58
-
 59
59 -
 60
60 -
 61
61 -
 62
62 -
 63
63 -
 64
64 -
 65
65 -
 66
66 -
 67
67 -
 68
68 -
 69
69 -
 70
70 -
 71
71 -
 72
72 -
 73
73 -
 74
74 -
 75
75 -
 76
76 -
 77
77 -
 78
78 -
 79
79 -
80
-
81
-
82
-
83
-
84
-
85
-
86
-
87
-
88
-
89
-
90
-
91
-
92
-
93
-
94
-
95
-
96
-
97
-
98
-
99
-
100
-
101
-
102
-
103
-
104
-
105
-
106
-
107
-
108
-
109
-
110
-
111
-
112
-
113
-
114
-
115
-
116
-
117
-
118
-
119
-
120
-
121
-
122
-
123
-
124
-
125
-
126
-
127
-
128
-
129
-
130
-
131
-
132
-
133
-
134
-
135
-
136
-
137
-
138
-
139
-
140
-
141
-
142
-
143
-
144
-
145
-
146
-
147
-
148
-
149
-
150
-
151
-
152
-
153
-
154
-
155
-
156
-
157
-
158
-
159
-
160
-
161
-
162
-
163
-
164
-
165
-
166
-
167
-
168
-
169
-
170
-
171
-
172
-
173
 |
 |

Table of Contents
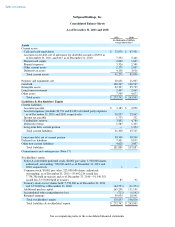
NetSpend Holdings, Inc.
Consolidated Balance Sheets
As of December 31, 2011 and 2010
See accompanying notes to the consolidated financial statements.
2011 2010
(in thousands of dollars,
except share data)
Assets
Current assets
Cash and cash equivalents
$
72,076
$
67,501
Accounts receivable, net of allowance for doubtful accounts of $581 as
of December 31, 2011 and $147 as of December 31, 2010
7,552
5,441
Prepaid card supply
2,000
1,605
Prepaid expenses
3,326
2,380
Other current assets
2,179
1,007
Deferred tax assets
4,138
3,916
Total current assets
91,271
81,850
Property and equipment, net
20,631
21,007
Goodwill
128,567
128,567
Intangible assets
22,227
25,739
Long
-
term investment
2,497
2,067
Other assets
7,549
4,673
Total assets
$
272,742
$
263,903
Liabilities & Stockholders' Equity
Current liabilities
Accounts payable
$
3,183
$
2,850
Accrued expenses (includes $3,791 and $3,433 of related party expenses
as of December 31, 2011 and 2010, respectively)
20,937
25,067
Income tax payable
1,733
332
Cardholders' reserve
3,892
4,789
Deferred revenue
1,585
1,333
Long
-
term debt, current portion
—
1,354
Total current liabilities
31,330
35,725
Long
-
term debt, net of current portion
58,500
58,500
Deferred tax liabilities
7,431
9,855
Other non
-
current liabilities
4,628
3,007
Total liabilities
101,889
107,087
Commitments and contingencies (Note 17)
Stockholders' equity
Series A convertible preferred stock, $0.001 par value; 1,500,000 shares
authorized; outstanding: 700,000 and 0 as of December 31, 2011 and
2010, respectively
1
—
Common stock, $0.001 par value; 225,000,000 shares authorized;
outstanding: as of December 31, 2011—85,492,234 issued less
7,758,386 held in treasury and as of December 31, 2010—91,540,381
issued less 3,370,000 held in treasury
85
92
Treasury stock at cost; shares held: 7,758,386 as of December 31, 2011
and 3,370,000 as of December 31, 2010
(44,753
)
(11,374
)
Additional paid
-
in capital
165,298
151,199
Accumulated other comprehensive loss
(712
)
(1,142
)
Retained earnings
50,934
18,041
Total stockholders' equity
170,853
156,816
Total liabilities & stockholders' equity
$
272,742
$
263,903