NetSpend 2010 Annual Report Download - page 99
Download and view the complete annual report
Please find page 99 of the 2010 NetSpend annual report below. You can navigate through the pages in the report by either clicking on the pages listed below, or by using the keyword search tool below to find specific information within the annual report.-
 1
1 -
2
-
3
-
4
-
5
-
6
-
7
-
8
-
9
-
10
-
11
-
12
-
13
-
14
-
15
-
16
-
17
-
18
-
19
-
20
-
21
-
22
-
23
-
24
-
25
-
26
-
27
-
28
-
29
-
30
-
31
-
32
-
33
-
34
-
35
-
36
-
37
-
38
-
39
-
40
-
41
-
42
-
43
-
44
-
45
-
46
-
47
-
48
-
49
-
50
-
51
-
52
-
53
-
54
-
55
-
56
-
57
-
58
-
59
-
60
-
61
-
62
-
63
-
64
-
65
-
66
-
67
-
68
-
69
-
70
-
71
-
72
-
73
-
74
-
75
-
76
-
77
-
78
-
79
-
80
-
81
-
82
-
83
-
84
-
85
-
86
-
87
-
88
-
 89
89 -
 90
90 -
 91
91 -
 92
92 -
 93
93 -
 94
94 -
 95
95 -
 96
96 -
 97
97 -
 98
98 -
 99
99 -
 100
100 -
 101
101 -
 102
102 -
 103
103 -
 104
104 -
 105
105 -
 106
106 -
 107
107 -
 108
108 -
 109
109 -
110
-
111
-
112
-
113
-
114
-
115
-
116
-
117
-
118
-
119
-
120
-
121
-
122
-
123
-
124
-
125
-
126
-
127
 |
 |

Table of Contents
NetSpend Holdings, Inc.
Notes to Consolidated Financial Statements (Continued)
December 31, 2008, 2009 and 2010
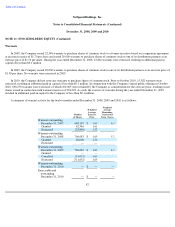
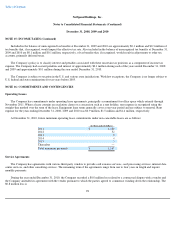
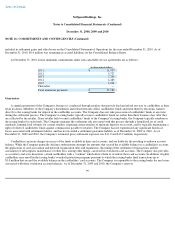
NOTE 13: COMPREHENSIVE INCOME
The Company's comprehensive income is included as a component of stockholders' equity and is composed of net income and unrealized
gains and losses on investments designated as available-for-sale. As of December 31, 2010, the Company had an unrealized loss of
$1.1 million, net of tax, related to the difference between the fair value of the long-term investment of $2.1 million on December 31, 2010 and
the $3.2 million purchase price.
The following table presents the calculation of comprehensive income:
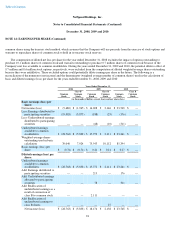
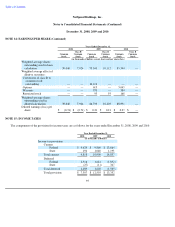
NOTE 14: EARNINGS PER SHARE
Basic earnings (loss) per common share is calculated by dividing net income (loss) available to common stockholders by the number of
weighted average common shares issued and outstanding for the period. The Company calculates basic and diluted earnings (loss) per share
using the treasury stock method, the if-converted method and the two-class method, as applicable.
Upon completion of the Company's initial public offering in October 2010, all shares of class A common stock were reclassified as
common stock. In addition, upon completion of the Company's initial public offering all shares of the Company's class B common stock were
transferred to members of Skylight Holdings I, LLC, which had the effect of converting all shares of the Company's outstanding class B
common stock into shares of common stock on a one-for-one basis. For the year ended December 31, 2010 the as-
if converted method has been
applied and therefore, the conversion of class B common stock into common stock is reflected as of the beginning of the reporting period.
Prior to the conversion of convertible series A preferred stock to common stock in 2008, convertible series A preferred stockholders had
rights to common stock dividends on an if-converted basis. For purposes of calculating earnings (loss) per share, the preferred shares are
considered participating securities. In calculating basic earnings (loss) per share in 2008, earnings available to series A preferred shares are
excluded from net income available to common stockholders.
In 2009, certain employees were issued options with rights to dividend equivalents. The options with dividend equivalent rights are
considered participating securities to the extent that the options have vested. In calculating basic earnings (loss) per share using the two-class
method, earnings available to participating securities are excluded from net income available to common shareholders.
Diluted earnings per common share is calculated by dividing net income available to common stockholders by the weighted average
number of common shares issued and outstanding for the period plus amounts representing the dilutive effect of stock options, warrants,
restricted stock and the conversion of convertible preferred stock, as applicable. The Company calculates dilutive potential
93
Year Ended
December 31,
2009 2010
(in thousands of dollars)
Net income
$
18,174
$
23,748
Unrealized holding loss on investment, net
of tax
—
(
1,142
)
Comprehensive income
$
18,174
$
22,606