NetSpend 2010 Annual Report Download - page 75
Download and view the complete annual report
Please find page 75 of the 2010 NetSpend annual report below. You can navigate through the pages in the report by either clicking on the pages listed below, or by using the keyword search tool below to find specific information within the annual report.-
 1
1 -
2
-
3
-
4
-
5
-
6
-
7
-
8
-
9
-
10
-
11
-
12
-
13
-
14
-
15
-
16
-
17
-
18
-
19
-
20
-
21
-
22
-
23
-
24
-
25
-
26
-
27
-
28
-
29
-
30
-
31
-
32
-
33
-
34
-
35
-
36
-
37
-
38
-
39
-
40
-
41
-
42
-
43
-
44
-
45
-
46
-
47
-
48
-
49
-
50
-
51
-
52
-
53
-
54
-
55
-
56
-
57
-
58
-
59
-
60
-
61
-
62
-
63
-
64
-
 65
65 -
 66
66 -
 67
67 -
 68
68 -
 69
69 -
 70
70 -
 71
71 -
 72
72 -
 73
73 -
 74
74 -
 75
75 -
 76
76 -
 77
77 -
 78
78 -
 79
79 -
 80
80 -
 81
81 -
 82
82 -
 83
83 -
 84
84 -
 85
85 -
86
-
87
-
88
-
89
-
90
-
91
-
92
-
93
-
94
-
95
-
96
-
97
-
98
-
99
-
100
-
101
-
102
-
103
-
104
-
105
-
106
-
107
-
108
-
109
-
110
-
111
-
112
-
113
-
114
-
115
-
116
-
117
-
118
-
119
-
120
-
121
-
122
-
123
-
124
-
125
-
126
-
127
 |
 |

Table of Contents
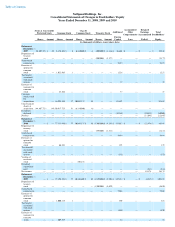
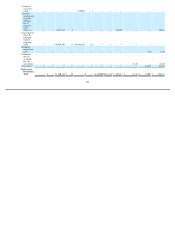
NetSpend Holdings, Inc.
Consolidated Statements of Changes in Stockholders' Equity
Years Ended December 31, 2008, 2009 and 2010
Series A Convertible
Preferred Stock
Class B
Common Stock
Common Stock
Treasury Stock
Accumulated
Other
Comprehensive
Loss
Retained
Earnings
(Accumulated
Deficit)
Additional
Paid-in
Capital
Total
Stockholders'
Equity
Shares
Amount
Shares
Amount
Shares
Amount
Shares
Amount
(in thousands of dollars, except share data)
Balances at
December 31,
2007
44,807,723
$
45
8,174,821
$
8
6,110,000
$
6
(400,000
)
$
(1,116
)
$
36,601
$
—
$
—
$
35,544
Repurchase of
treasury
stock
—
—
—
—
—
—
(
900,000
)
(3,177
)
—
—
—
(
3,177
)
Stock-based
compensation
—
—
—
—
—
—
—
—
2,473
—
—
2,473
Exercise of
options for
common
stock
—
—
1,022,965
1
—
—
—
—
1,226
—
—
1,227
Tax benefit
associated
with stock
options
—
—
—
—
—
—
—
—
37
—
—
37
Exercise of
warrants for
common
stock
—
—
23,846
—
—
—
—
—
37
—
—
37
Common
stock issued
for
acquisitions
—
—
16,992,555
17
10,043,137
10
—
—
93,822
—
—
93,849
Conversion of
shares at
acquisition
(44,807,723
)
(45
)
50,917,723
51
(6,110,000
)
(6
)
—
—
—
—
—
—
Dividends
declared
—
—
—
—
—
—
—
—
(
19,169
)
—
(
10,831
)
(30,000
)
Net loss
—
—
—
—
—
—
—
—
—
—
(
11,645
)
(11,645
)
Balances at
December 31,
2008
—
$
—
77,131,910
$
77
10,043,137
$
10
(1,300,000
)
$
(4,293
)
$
115,027
$
—
$
(
22,476
)
$
88,345
Repurchase of
treasury
stock
—
—
—
—
—
—
(
570,000
)
(1,411
)
—
—
—
(
1,411
)
Stock-based
compensation
—
—
—
—
—
—
—
—
4,484
—
—
4,484
Exercise of
options for
common
stock
—
—
66,283
—
—
—
—
—
125
—
—
125
Tax shortfall
associated
with stock
options
—
—
—
—
—
—
—
—
(
152
)
—
—
(
152
)
Vesting of
restricted
stock
—
—
—
—
201,472
—
—
—
—
—
—
—
Dividend
equivalents
paid
—
—
—
—
—
—
—
—
—
—
(
213
)
(213
)
Net income
—
—
—
—
—
—
—
—
—
—
18,174
18,174
Balances at
December 31,
2009
—
$
—
77,198,193
$
77
10,244,609
$
10
(1,870,000
)
$
(5,704
)
$
119,484
$
—
$
(
4,515
)
$
109,352
Repurchase of
treasury
stock
—
—
—
—
—
—
(
1,500,000
)
(5,670
)
—
—
—
(
5,670
)
Stock-based
compensation
—
—
—
—
—
—
—
—
7,268
—
—
7,268
Exercise of
options for
common
stock
—
—
1,000,215
1
—
—
—
—
850
—
—
851
Tax benefit
associated
with stock
options
—
—
—
—
—
—
—
—
1,520
—
—
1,520
Exercise of
warrants for
common
stock
—
—
609,587
1
—
—
—
—
82
—
—
83