NetSpend 2010 Annual Report Download - page 72
Download and view the complete annual report
Please find page 72 of the 2010 NetSpend annual report below. You can navigate through the pages in the report by either clicking on the pages listed below, or by using the keyword search tool below to find specific information within the annual report.-
 1
1 -
2
-
3
-
4
-
5
-
6
-
7
-
8
-
9
-
10
-
11
-
12
-
13
-
14
-
15
-
16
-
17
-
18
-
19
-
20
-
21
-
22
-
23
-
24
-
25
-
26
-
27
-
28
-
29
-
30
-
31
-
32
-
33
-
34
-
35
-
36
-
37
-
38
-
39
-
40
-
41
-
42
-
43
-
44
-
45
-
46
-
47
-
48
-
49
-
50
-
51
-
52
-
53
-
54
-
55
-
56
-
57
-
58
-
59
-
60
-
61
-
 62
62 -
 63
63 -
 64
64 -
 65
65 -
 66
66 -
 67
67 -
 68
68 -
 69
69 -
 70
70 -
 71
71 -
 72
72 -
 73
73 -
 74
74 -
 75
75 -
 76
76 -
 77
77 -
 78
78 -
 79
79 -
 80
80 -
 81
81 -
 82
82 -
83
-
84
-
85
-
86
-
87
-
88
-
89
-
90
-
91
-
92
-
93
-
94
-
95
-
96
-
97
-
98
-
99
-
100
-
101
-
102
-
103
-
104
-
105
-
106
-
107
-
108
-
109
-
110
-
111
-
112
-
113
-
114
-
115
-
116
-
117
-
118
-
119
-
120
-
121
-
122
-
123
-
124
-
125
-
126
-
127
 |
 |

Table of Contents
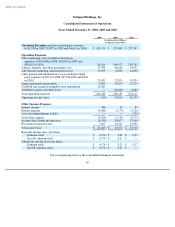
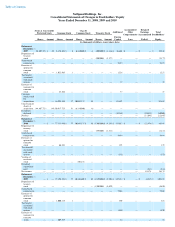
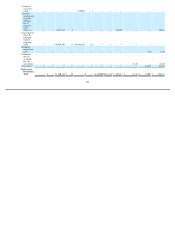
NetSpend Holdings, Inc.
Consolidated Balance Sheets
As of December 31, 2009 and 2010
See accompanying notes to the consolidated financial statements.
68
2009 2010
(in thousands
of dollars,
except share data)
Assets
Current assets
Cash and cash equivalents
$
21,154
$
67,501
Accounts receivable, net of allowance for doubtful accounts of $50 as of
December 31, 2009 and $147 as of December 31, 2010
4,513
5,441
Prepaid card supply
1,783
1,605
Prepaid expenses
2,357
2,380
Other current assets
1,845
1,007
Income tax receivable
2,375
—
Deferred tax assets
2,872
3,916
Total current assets
36,899
81,850
Property and equipment, net
24,441
21,007
Goodwill
128,567
128,567
Intangible assets
28,981
25,739
Long
-
term investment
—
2,067
Other assets
3,397
4,673
Total assets
$
222,285
$
263,903
Liabilities & Stockholders' Equity
Current liabilities
Accounts payable (includes $609 and $0 of related party payables at
December 31, 2009 and 2010, respectively)
$
3,444
$
2,850
Accrued expenses (includes $2,593 and $3,433 of related party expenses at
December 31, 2009 and 2010, respectively)
21,531
25,067
Income tax payable
—
332
Cardholders' reserve
1,620
4,789
Deferred revenue
2,158
1,333
Long
-
term debt, current portion
21,513
1,354
Total current liabilities
50,266
35,725
Long
-
term debt, net of current portion
51,979
58,500
Deferred tax liabilities
10,318
9,855
Other non
-
current liabilities
370
3,007
Total liabilities
112,933
107,087
Commitments and contingencies (Note 16)
Stockholders' equity
Common stock, $0.001 par value; shares authorized: 150,000,000 at
December 31, 2009 and 225,000,000 at December 31, 2010; shares
issued: 77,198,193 at December 31, 2009 and 91,540,381 at
December 31, 2010
77
92
Class B common stock, $0.001 par value, 15,000,000 authorized at
December 31, 2009 and 2010 and 10,244,609 issued and outstanding at
December 31, 2009
10
—
Treasury stock at cost; shares held: 1,870,000 at December 31, 2009 and
3,370,000 at December 31, 2010
(5,704
)
(11,374
)
Additional paid
-
in capital
119,484
150,183
Accumulated other comprehensive loss
—
(
1,142
)
Retained earnings (accumulated deficit)
(4,515
)
19,057
Total stockholders' equity
109,352
156,816
Total liabilities & stockholders' equity
$
222,285
$
263,903