NetSpend 2010 Annual Report Download - page 110
Download and view the complete annual report
Please find page 110 of the 2010 NetSpend annual report below. You can navigate through the pages in the report by either clicking on the pages listed below, or by using the keyword search tool below to find specific information within the annual report.-
 1
1 -
2
-
3
-
4
-
5
-
6
-
7
-
8
-
9
-
10
-
11
-
12
-
13
-
14
-
15
-
16
-
17
-
18
-
19
-
20
-
21
-
22
-
23
-
24
-
25
-
26
-
27
-
28
-
29
-
30
-
31
-
32
-
33
-
34
-
35
-
36
-
37
-
38
-
39
-
40
-
41
-
42
-
43
-
44
-
45
-
46
-
47
-
48
-
49
-
50
-
51
-
52
-
53
-
54
-
55
-
56
-
57
-
58
-
59
-
60
-
61
-
62
-
63
-
64
-
65
-
66
-
67
-
68
-
69
-
70
-
71
-
72
-
73
-
74
-
75
-
76
-
77
-
78
-
79
-
80
-
81
-
82
-
83
-
84
-
85
-
86
-
87
-
88
-
89
-
90
-
91
-
92
-
93
-
94
-
95
-
96
-
97
-
98
-
99
-
 100
100 -
 101
101 -
 102
102 -
 103
103 -
 104
104 -
 105
105 -
 106
106 -
 107
107 -
 108
108 -
 109
109 -
 110
110 -
 111
111 -
 112
112 -
 113
113 -
 114
114 -
 115
115 -
 116
116 -
 117
117 -
 118
118 -
 119
119 -
 120
120 -
121
-
122
-
123
-
124
-
125
-
126
-
127
 |
 |

Table of Contents
NetSpend Holdings, Inc.
Notes to Consolidated Financial Statements (Continued)
December 31, 2008, 2009 and 2010
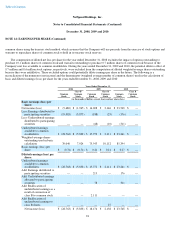
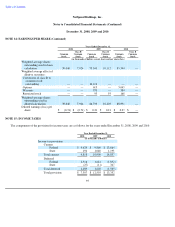
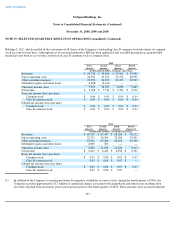
NOTE 19: SELECTED QUARTERLY RESULTS OF OPERATIONS (unaudited) (Continued)
Holdings I, LLC, which resulted in the conversion of all shares of the Company's outstanding class B common stock into shares of common
stock on a one-for-one basis. Although the as-if converted method for EPS has been applied for full year EPS presentation, quarterly EPS
results have not been re-cast for the conversion of class B common stock to common stock.
(1) In addition to the Company's recurring provisions for negative cardholder account activity, during the fourth quarter of 2010, the
Company recorded approximately $1.3 million of additional charges associated with chargebacks and other losses resulting from
recoveries that had been incorrectly processed in periods prior to the fourth quarter of 2010. These amounts were accrued within the
103
2009
First
Quarter Second
Quarter Third
Quarter Fourth
Quarter
(in thousands of dollars, except per share data)
Revenues
$
54,738
$
54,898
$
55,962
$
59,402
Direct operating costs
26,594
25,232
25,754
28,992
Other operating expenses
21,959
24,890
23,250
22,743
Settlement (gains) and other losses
(1,068
)
(9,161
)
—
—
Operating income (loss)
7,253
13,937
6,958
7,667
Net income
$
3,568
$
7,510
$
3,580
$
3,516
Basic net income (loss) per share
Common stock
$
0.04
$
0.09
$
0.04
$
0.04
Class B common stock
$
0.04
$
0.09
$
0.04
$
0.04
Diluted net income (loss) per share
Common stock
$
0.04
$
0.09
$
0.04
$
0.04
Class B common stock
$
0.04
$
0.09
$
0.04
$
0.04
2010
First
Quarter Second
Quarter Third
Quarter Fourth
Quarter(1)
(in thousands of dollars, except per share data)
Revenues
$
69,520
$
67,447
$
68,208
$
70,212
Direct operating costs
32,713
30,304
32,364
35,402
Other operating expenses
23,911
25,204
24,518
25,396
Settlement (gains) and other losses
4,000
300
—
—
Operating income (loss)
8,896
11,639
11,326
9,414
Net income
$
4,618
$
6,446
$
6,380
$
6,304
Basic net income (loss) per share:
Common stock
$
0.05
$
0.08
$
0.07
$
0.07
Class B common stock
0.05
$
0.08
$
0.07
$
—
Diluted net income (loss) per share:
Common stock
$
0.05
$
0.08
$
0.07
$
0.07
Class B common stock
0.05
$
0.08
$
0.07
—