NetSpend 2010 Annual Report Download - page 52
Download and view the complete annual report
Please find page 52 of the 2010 NetSpend annual report below. You can navigate through the pages in the report by either clicking on the pages listed below, or by using the keyword search tool below to find specific information within the annual report.-
 1
1 -
2
-
3
-
4
-
5
-
6
-
7
-
8
-
9
-
10
-
11
-
12
-
13
-
14
-
15
-
16
-
17
-
18
-
19
-
20
-
21
-
22
-
23
-
24
-
25
-
26
-
27
-
28
-
29
-
30
-
31
-
32
-
33
-
34
-
35
-
36
-
37
-
38
-
39
-
40
-
41
-
 42
42 -
 43
43 -
 44
44 -
 45
45 -
 46
46 -
 47
47 -
 48
48 -
 49
49 -
 50
50 -
 51
51 -
 52
52 -
 53
53 -
 54
54 -
 55
55 -
 56
56 -
 57
57 -
 58
58 -
 59
59 -
 60
60 -
 61
61 -
 62
62 -
63
-
64
-
65
-
66
-
67
-
68
-
69
-
70
-
71
-
72
-
73
-
74
-
75
-
76
-
77
-
78
-
79
-
80
-
81
-
82
-
83
-
84
-
85
-
86
-
87
-
88
-
89
-
90
-
91
-
92
-
93
-
94
-
95
-
96
-
97
-
98
-
99
-
100
-
101
-
102
-
103
-
104
-
105
-
106
-
107
-
108
-
109
-
110
-
111
-
112
-
113
-
114
-
115
-
116
-
117
-
118
-
119
-
120
-
121
-
122
-
123
-
124
-
125
-
126
-
127
 |
 |

Table of Contents
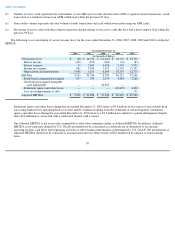
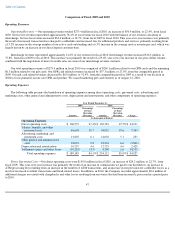
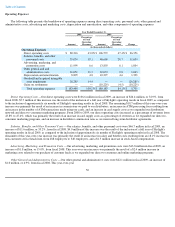
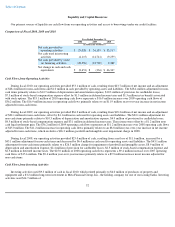
From 2009 to 2010, our direct operating costs increased slightly as a percentage of revenues from 47.4% to 47.5%, which was primarily the
result of an increase in cardholders' losses offset by a decrease in commissions as a percentage of revenue due to an increase in cards
distributed through direct-to-consumer marketing programs, on which no commissions were paid.
Salaries, Benefits, and Other Personnel Costs —Our salaries, benefits, and other personnel costs were $54.0 million in fiscal 2010, an
increase of $7.4 million, or 15.8%, from fiscal 2009. This year-over-year increase was primarily due to additional compensation expense that
was recognized as a result of the accelerated vesting of certain options and shares of restricted stock in connection with our initial public
offering, an increase in average non-customer service headcount, as well as incremental bonus expense as we exceeded our plan in 2010.
Advertising, Marketing, and Promotion Costs —
Our advertising, marketing, and promotion costs were $14.0 million in fiscal 2010, which
remained relatively consistent with fiscal 2009.
Other General and Administrative Costs —Our other general and administrative costs were $18.2 million in fiscal 2010, a decrease of
$3.8 million, or 17.4%, from fiscal 2009. This year-over-year decrease was primarily due to a decrease in accounting and legal professional
services as well as a decrease in IT professional services resulting from the completion of our financial infrastructure project in 2009.
Depreciation and Amortization —Our depreciation and amortization costs were $12.7 million in fiscal 2010, an increase of $2.4 million,
or 23.6%, from fiscal 2009. This increase was primarily the result of depreciation on our 2009 and 2010 capital expenditures of $14.6 million
and $6.0 million, respectively.
Settlement (Gains) and Other Losses —We recognized $4.3 million of losses during fiscal 2010, of which $3.5 million related to a patent
infringement dispute and $0.8 million related to a contractual dispute with a vendor. In fiscal 2009, we recognized $10.2 million of settlement
gains, $9.0 million of which related to recoveries of excess funds from our issuing banks for historical fee and chargeback recoveries, with the
remaining $1.2 million resulting from a litigation settlement.
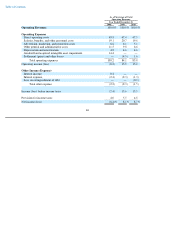
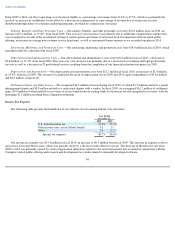
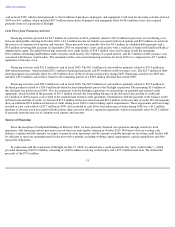
Income Tax Expense
The following table presents the breakdown of our effective tax rate among federal, state and other:
Our income tax expense was $13.4 million in fiscal 2010, an increase of $0.9 million from fiscal 2009. This increase in expense is due to
an increase in income before taxes, which was partially offset by a decrease in the effective tax rate. The decrease in the effective rate from
2009 to 2010 was primarily caused by stock compensation deductions related to the stock transactions that occurred in conjunction with the
Company's initial public offering and research and development tax credits related to internally developed software.
48
Year Ended
December 31,
2009 2010
U.S. federal income tax
35.0
%
35.0
%
State income taxes, net of federal benefit
3.3
3.1
Other
2.4
(2.1
)
Income tax expense
40.7
%
36.0
%