NetSpend 2010 Annual Report Download - page 53
Download and view the complete annual report
Please find page 53 of the 2010 NetSpend annual report below. You can navigate through the pages in the report by either clicking on the pages listed below, or by using the keyword search tool below to find specific information within the annual report.-
 1
1 -
2
-
3
-
4
-
5
-
6
-
7
-
8
-
9
-
10
-
11
-
12
-
13
-
14
-
15
-
16
-
17
-
18
-
19
-
20
-
21
-
22
-
23
-
24
-
25
-
26
-
27
-
28
-
29
-
30
-
31
-
32
-
33
-
34
-
35
-
36
-
37
-
38
-
39
-
40
-
41
-
42
-
 43
43 -
 44
44 -
 45
45 -
 46
46 -
 47
47 -
 48
48 -
 49
49 -
 50
50 -
 51
51 -
 52
52 -
 53
53 -
 54
54 -
 55
55 -
 56
56 -
 57
57 -
 58
58 -
 59
59 -
 60
60 -
 61
61 -
 62
62 -
 63
63 -
64
-
65
-
66
-
67
-
68
-
69
-
70
-
71
-
72
-
73
-
74
-
75
-
76
-
77
-
78
-
79
-
80
-
81
-
82
-
83
-
84
-
85
-
86
-
87
-
88
-
89
-
90
-
91
-
92
-
93
-
94
-
95
-
96
-
97
-
98
-
99
-
100
-
101
-
102
-
103
-
104
-
105
-
106
-
107
-
108
-
109
-
110
-
111
-
112
-
113
-
114
-
115
-
116
-
117
-
118
-
119
-
120
-
121
-
122
-
123
-
124
-
125
-
126
-
127
 |
 |

Table of Contents
Comparison of Fiscal 2008 and 2009
Operating Revenues
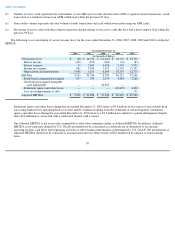
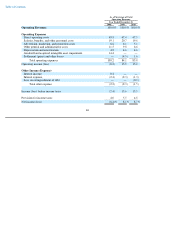
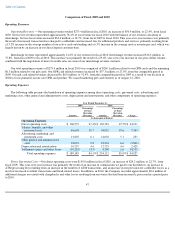
Operating Revenues —Our operating revenues totaled $225.0 million in fiscal 2009, an increase of $41.8 million, or 22.8%, from fiscal
2008. Service fee revenue represented approximately 80.7% of our revenue for fiscal 2009 with the balance of our revenue consisting of
interchange. Service fee revenue increased $29.5 million, or 19.4%, from fiscal 2008 to fiscal 2009. $16.7 million of the $29.5 million year-
over-
year increase in service fee revenues resulted from the inclusion of a full year of Skylight's operating results in fiscal 2009, as compared to
the inclusion of only six months of Skylight's operating results in fiscal 2008. The remainder of this year-over-year increase was primarily the
result of increased transaction fees charged to cardholders and increased fees for additional products and services unrelated to the Skylight
acquisition, primarily resulting from a 15.3% increase in the average number of our active cards outstanding. $6.7 million of the increase in
transaction fees was caused by rate changes in the fees charged for domestic ATM transactions. These increases were offset by a decrease in
customer service and maintenance fees unrelated to the Skylight acquisition, caused primarily by decreased gift maintenance as we focused our
business on our core GPR card product. Finally, there was a decrease of $5.0 million in other revenues caused by decreased third-party
processing services under an agreement with a large national bank that we terminated in 2008 effective in 2009.
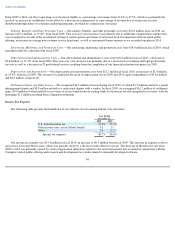
Interchange revenue represented approximately 19.3% of our revenue for fiscal 2009. Interchange revenue increased $12.3 million, or
39.7%, from fiscal 2008 to fiscal 2009. $0.8 million of the $12.3 million year-over-year increase in our interchange revenues resulted from the
inclusion of a full year of Skylight's operating results in fiscal 2009, as compared to approximately six months of Skylight's operating results in
fiscal 2008. The remainder of this increase was primarily the result of a year-over-year increase in the average number of active cards
outstanding.
Our total operating revenues of $225.0 million in fiscal 2009 was comprised of $211.6 million related to our GPR cards and the remaining
$13.4 million related to our gift cards. Our GPR card related revenues increased by $52.8 million, or 33.2%, from the comparable period in
2008. Our gift card related revenues decreased by $11.0 million, or 45.1%, from the comparable period in 2008 as a result of our decision in
2008 to focus primarily on our core GPR card product. We ceased marketing gift cards entirely as of August 21, 2010.
49