NetSpend 2010 Annual Report Download - page 74
Download and view the complete annual report
Please find page 74 of the 2010 NetSpend annual report below. You can navigate through the pages in the report by either clicking on the pages listed below, or by using the keyword search tool below to find specific information within the annual report.-
 1
1 -
2
-
3
-
4
-
5
-
6
-
7
-
8
-
9
-
10
-
11
-
12
-
13
-
14
-
15
-
16
-
17
-
18
-
19
-
20
-
21
-
22
-
23
-
24
-
25
-
26
-
27
-
28
-
29
-
30
-
31
-
32
-
33
-
34
-
35
-
36
-
37
-
38
-
39
-
40
-
41
-
42
-
43
-
44
-
45
-
46
-
47
-
48
-
49
-
50
-
51
-
52
-
53
-
54
-
55
-
56
-
57
-
58
-
59
-
60
-
61
-
62
-
63
-
 64
64 -
 65
65 -
 66
66 -
 67
67 -
 68
68 -
 69
69 -
 70
70 -
 71
71 -
 72
72 -
 73
73 -
 74
74 -
 75
75 -
 76
76 -
 77
77 -
 78
78 -
 79
79 -
 80
80 -
 81
81 -
 82
82 -
 83
83 -
 84
84 -
85
-
86
-
87
-
88
-
89
-
90
-
91
-
92
-
93
-
94
-
95
-
96
-
97
-
98
-
99
-
100
-
101
-
102
-
103
-
104
-
105
-
106
-
107
-
108
-
109
-
110
-
111
-
112
-
113
-
114
-
115
-
116
-
117
-
118
-
119
-
120
-
121
-
122
-
123
-
124
-
125
-
126
-
127
 |
 |

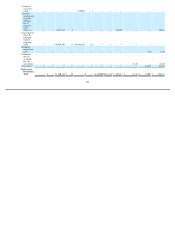
Table of Contents
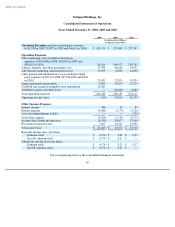
NetSpend Holdings, Inc.
Consolidated Statements of Operations
Years Ended December 31, 2008, 2009 and 2010
See accompanying notes to the consolidated financial statements.
69
2008 2009 2010
(in thousands of dollars,
except per share data)
Operating Revenues (includes related party revenues
of $1,590 in 2008, $2,897 in 2009 and $4,611 in 2010)
$
183,170
$
225,000
$
275,387
Operating Expenses
Direct operating costs (includes related party
expenses of $24,408 in 2008, $28,903 in 2009 and
$38,625 in 2010)
80,216
106,572
130,783
Salaries, benefits, and other personnel costs
35,034
46,668
54,032
Advertising, marketing, and promotion costs
11,999
13,803
14,038
Other general and administrative costs (includes related
party expenses of $211 in 2008, $157 in 2009 and $210
in 2010)
21,051
22,074
18,234
Depreciation and amortization
8,899
10,297
12,725
Goodwill and acquired intangible asset impairment
26,285
—
—
Settlement (gains) and other losses
—
(
10,229
)
4,300
Total operating expenses
183,484
189,185
234,112
Operating income (loss)
(314
)
35,815
41,275
Other Income (Expense)
Interest income
384
32
85
Interest expense
(4,408
)
(5,170
)
(3,526
)
Loss on extinguishment of debt
—
—
(
734
)
Total other expense
(4,024
)
(5,138
)
(4,175
)
Income (loss) before income taxes
(4,338
)
30,677
37,100
Provision for income taxes
7,307
12,503
13,352
Net income (loss)
$
(11,645
)
$
18,174
$
23,748
Basic net income (loss) per share:
Common stock
$
(0.74
)
$
0.21
$
0.27
Class B common stock
$
(0.74
)
$
0.21
$
—
Diluted net income (loss) per share:
Common stock
$
(0.74
)
$
0.21
$
0.27
Class B common stock
$
(0.74
)
$
0.21
$
—