NetSpend 2010 Annual Report Download - page 102
Download and view the complete annual report
Please find page 102 of the 2010 NetSpend annual report below. You can navigate through the pages in the report by either clicking on the pages listed below, or by using the keyword search tool below to find specific information within the annual report.-
 1
1 -
2
-
3
-
4
-
5
-
6
-
7
-
8
-
9
-
10
-
11
-
12
-
13
-
14
-
15
-
16
-
17
-
18
-
19
-
20
-
21
-
22
-
23
-
24
-
25
-
26
-
27
-
28
-
29
-
30
-
31
-
32
-
33
-
34
-
35
-
36
-
37
-
38
-
39
-
40
-
41
-
42
-
43
-
44
-
45
-
46
-
47
-
48
-
49
-
50
-
51
-
52
-
53
-
54
-
55
-
56
-
57
-
58
-
59
-
60
-
61
-
62
-
63
-
64
-
65
-
66
-
67
-
68
-
69
-
70
-
71
-
72
-
73
-
74
-
75
-
76
-
77
-
78
-
79
-
80
-
81
-
82
-
83
-
84
-
85
-
86
-
87
-
88
-
89
-
90
-
91
-
 92
92 -
 93
93 -
 94
94 -
 95
95 -
 96
96 -
 97
97 -
 98
98 -
 99
99 -
 100
100 -
 101
101 -
 102
102 -
 103
103 -
 104
104 -
 105
105 -
 106
106 -
 107
107 -
 108
108 -
 109
109 -
 110
110 -
 111
111 -
 112
112 -
113
-
114
-
115
-
116
-
117
-
118
-
119
-
120
-
121
-
122
-
123
-
124
-
125
-
126
-
127
 |
 |

Table of Contents
NetSpend Holdings, Inc.
Notes to Consolidated Financial Statements (Continued)
December 31, 2008, 2009 and 2010
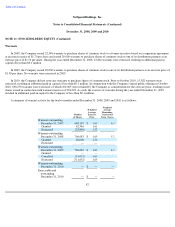
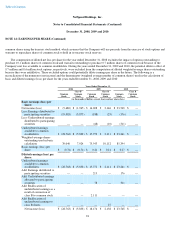
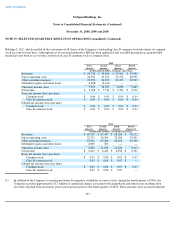
NOTE 14: EARNINGS PER SHARE (Continued)
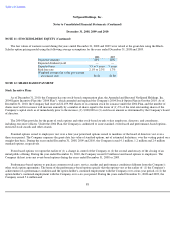
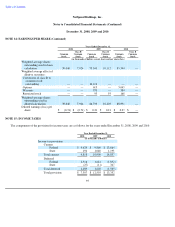
NOTE 15: INCOME TAXES
The components of the provision for income taxes are as follows for the years ended December 31, 2008, 2009 and 2010:
95
Years Ended December 31,
2008 2009 2010
Common
Stock
Class B
Common
Stock Common
Stock
Class B
Common
Stock Common
Stock
Class B
Common
Stock
(in thousands of dollars, except share and per share data)
Weighted-average shares
outstanding used in basic
calculation
39,040
7,924
75,543
10,112
85,394
—
Weighted average effect of
dilutive securities:
Conversion of class B to
common stock
outstanding
—
—
10,112
—
—
—
Options
—
—
615
—
3,045
—
Warrants
—
—
370
—
384
—
Restricted stock
—
—
93
93
168
—
Weighted-average shares
outstanding used in
diluted calculation
39,040
7,924
86,733
10,205
88,991
—
Diluted earnings (loss) per
share
$
(0.74
)
$
(0.74
)
$
0.21
$
0.21
$
0.27
$
—
Year Ended December 31,
2008 2009 2010
(in thousands of dollars)
Income tax provision
Current
Federal
$
4,624
$
9,860
$
13,664
State
194
1,040
1,193
Total current
4,818
10,900
14,857
Deferred
Federal
2,516
1,614
(1,852
)
State
(27
)
(11
)
347
Total deferred
2,489
1,603
(1,505
)
Total provision
$
7,307
$
12,503
$
13,352