NetSpend 2010 Annual Report Download - page 50
Download and view the complete annual report
Please find page 50 of the 2010 NetSpend annual report below. You can navigate through the pages in the report by either clicking on the pages listed below, or by using the keyword search tool below to find specific information within the annual report.-
 1
1 -
2
-
3
-
4
-
5
-
6
-
7
-
8
-
9
-
10
-
11
-
12
-
13
-
14
-
15
-
16
-
17
-
18
-
19
-
20
-
21
-
22
-
23
-
24
-
25
-
26
-
27
-
28
-
29
-
30
-
31
-
32
-
33
-
34
-
35
-
36
-
37
-
38
-
39
-
 40
40 -
 41
41 -
 42
42 -
 43
43 -
 44
44 -
 45
45 -
 46
46 -
 47
47 -
 48
48 -
 49
49 -
 50
50 -
 51
51 -
 52
52 -
 53
53 -
 54
54 -
 55
55 -
 56
56 -
 57
57 -
 58
58 -
 59
59 -
 60
60 -
61
-
62
-
63
-
64
-
65
-
66
-
67
-
68
-
69
-
70
-
71
-
72
-
73
-
74
-
75
-
76
-
77
-
78
-
79
-
80
-
81
-
82
-
83
-
84
-
85
-
86
-
87
-
88
-
89
-
90
-
91
-
92
-
93
-
94
-
95
-
96
-
97
-
98
-
99
-
100
-
101
-
102
-
103
-
104
-
105
-
106
-
107
-
108
-
109
-
110
-
111
-
112
-
113
-
114
-
115
-
116
-
117
-
118
-
119
-
120
-
121
-
122
-
123
-
124
-
125
-
126
-
127
 |
 |

Table of Contents
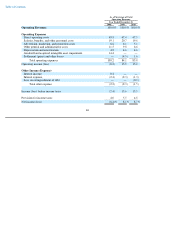
46
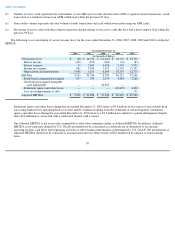
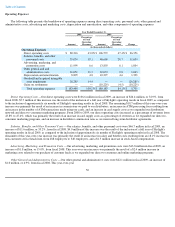
As a Percentage of Total
Operating Revenues
Year Ended December 31,
2008 2009 2010
Operating Revenues
100.0
%
100.0
%
100.0
%
Operating Expenses
Direct operating costs
43.8
47.4
47.5
Salaries, benefits, and other personnel costs
19.1
20.7
19.6
Advertising, marketing, and promotion costs
6.6
6.1
5.1
Other general and administrative costs
11.5
9.8
6.6
Depreciation and amortization
4.8
4.6
4.6
Goodwill and acquired intangible asset impairment
14.4
—
—
Settlement (gains) and other losses
—
(
4.5
)
1.6
Total operating expenses
100.2
84.1
85.0
Operating income (loss)
(0.2
)
15.9
15.0
Other Income (Expense)
Interest income
0.2
—
—
Interest expense
(2.4
)
(2.3
)
(1.3
)
Loss on extinguishment of debt
—
—
(
0.2
)
Total other expense
(2.2
)
(2.3
)
(1.5
)
Income (loss) before income taxes
(2.4
)
13.6
13.5
Provision for income taxes
4.0
5.5
4.8
Net income (loss)
(6.4
)%
8.1
%
8.7
%