NetSpend 2010 Annual Report Download - page 55
Download and view the complete annual report
Please find page 55 of the 2010 NetSpend annual report below. You can navigate through the pages in the report by either clicking on the pages listed below, or by using the keyword search tool below to find specific information within the annual report.-
 1
1 -
2
-
3
-
4
-
5
-
6
-
7
-
8
-
9
-
10
-
11
-
12
-
13
-
14
-
15
-
16
-
17
-
18
-
19
-
20
-
21
-
22
-
23
-
24
-
25
-
26
-
27
-
28
-
29
-
30
-
31
-
32
-
33
-
34
-
35
-
36
-
37
-
38
-
39
-
40
-
41
-
42
-
43
-
44
-
 45
45 -
 46
46 -
 47
47 -
 48
48 -
 49
49 -
 50
50 -
 51
51 -
 52
52 -
 53
53 -
 54
54 -
 55
55 -
 56
56 -
 57
57 -
 58
58 -
 59
59 -
 60
60 -
 61
61 -
 62
62 -
 63
63 -
 64
64 -
 65
65 -
66
-
67
-
68
-
69
-
70
-
71
-
72
-
73
-
74
-
75
-
76
-
77
-
78
-
79
-
80
-
81
-
82
-
83
-
84
-
85
-
86
-
87
-
88
-
89
-
90
-
91
-
92
-
93
-
94
-
95
-
96
-
97
-
98
-
99
-
100
-
101
-
102
-
103
-
104
-
105
-
106
-
107
-
108
-
109
-
110
-
111
-
112
-
113
-
114
-
115
-
116
-
117
-
118
-
119
-
120
-
121
-
122
-
123
-
124
-
125
-
126
-
127
 |
 |
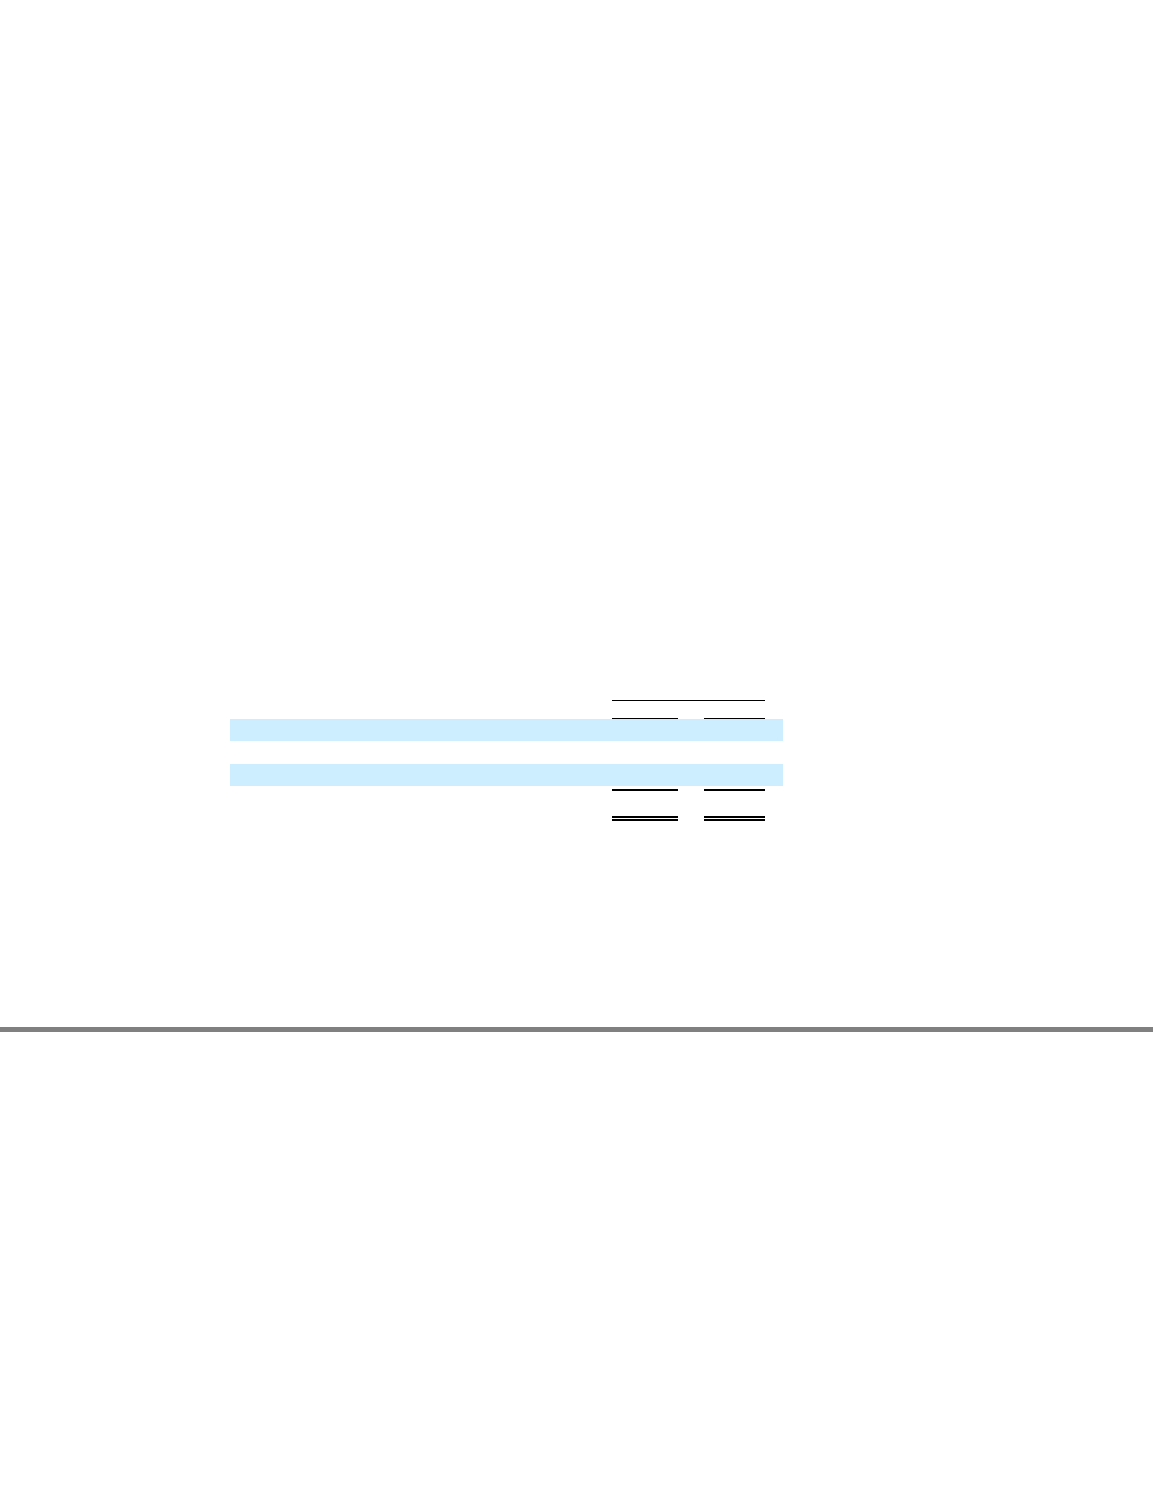
Table of Contents
increase was caused by the inclusion of a full year of Skylight's operating results in fiscal 2009, as compared to approximately six months of
activity in fiscal 2008.
Depreciation and Amortization —Our depreciation and amortization costs were $10.3 million in fiscal 2009, an increase of $1.4 million,
or 15.7%, from fiscal 2008. $1.0 million of this increase was the result of the inclusion of a full year of amortization related to Skylight's
intangible assets in fiscal 2009, as compared to the inclusion of approximately six months of amortization related to Skylight's intangible assets
in fiscal 2008. The remainder of this increase was primarily the result of depreciation on our 2008 and 2009 capital expenditures of
$10.7 million and $14.6 million, respectively.
Goodwill and Acquired Intangible Asset Impairment —In 2008, we recognized $26.3 million in goodwill and intangible asset impairment
related to our Skylight reporting unit. Goodwill and intangible assets with indefinite lives are tested for impairment annually or if an event
occurs or conditions change that would more likely than not reduce the fair value below the carrying value. Based on a combination of
comparative market multiples and discounted cash flow analyses, we determined that the carrying value of the goodwill attributed to the
Skylight reporting unit exceeded its fair value by approximately $23.0 million and that the carrying value of the Skylight tradename exceeded
its fair value by $3.3 million. The impairment was caused by declining market conditions and the adverse business environment in which our
Skylight reporting unit was then operating. There was no impairment of goodwill or intangible assets in 2009.
Settlement Gains —We recognized $10.2 million of settlement gains during fiscal 2009, $9.0 million of which related to recoveries of
excess funds from our issuing banks for historical fee and chargeback recoveries, with the remaining $1.2 million resulting from a litigation
settlement.
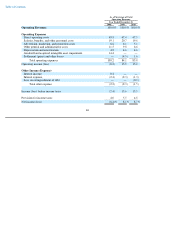
Income Tax Expense
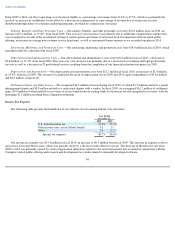
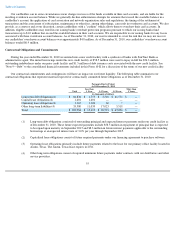
The following table presents the breakdown of our effective tax rate among federal, state and other:
Our income tax expense was $12.5 million in 2009, an increase of $5.2 million from fiscal 2008. Approximately $4.1 million of this
increase relates to taxes due for gains on settlements recognized during fiscal 2009. The remainder of this increase is due to growth unrelated to
the Skylight acquisition and increased income before taxes. The effective rate difference from 2008 to 2009 is primarily caused by the
$26.3 million non-deductible goodwill and intangible asset impairment recognized during 2008.
51
Year Ended
December 31,
2008 2009
U.S. federal income tax
(35.0
)%
35.0
%
State income taxes, net of federal benefit
3.9
3.3
Other
199.5
2.4
Income tax expense
168.4
%
40.7
%