NetSpend 2010 Annual Report Download - page 54
Download and view the complete annual report
Please find page 54 of the 2010 NetSpend annual report below. You can navigate through the pages in the report by either clicking on the pages listed below, or by using the keyword search tool below to find specific information within the annual report.-
 1
1 -
2
-
3
-
4
-
5
-
6
-
7
-
8
-
9
-
10
-
11
-
12
-
13
-
14
-
15
-
16
-
17
-
18
-
19
-
20
-
21
-
22
-
23
-
24
-
25
-
26
-
27
-
28
-
29
-
30
-
31
-
32
-
33
-
34
-
35
-
36
-
37
-
38
-
39
-
40
-
41
-
42
-
43
-
 44
44 -
 45
45 -
 46
46 -
 47
47 -
 48
48 -
 49
49 -
 50
50 -
 51
51 -
 52
52 -
 53
53 -
 54
54 -
 55
55 -
 56
56 -
 57
57 -
 58
58 -
 59
59 -
 60
60 -
 61
61 -
 62
62 -
 63
63 -
 64
64 -
65
-
66
-
67
-
68
-
69
-
70
-
71
-
72
-
73
-
74
-
75
-
76
-
77
-
78
-
79
-
80
-
81
-
82
-
83
-
84
-
85
-
86
-
87
-
88
-
89
-
90
-
91
-
92
-
93
-
94
-
95
-
96
-
97
-
98
-
99
-
100
-
101
-
102
-
103
-
104
-
105
-
106
-
107
-
108
-
109
-
110
-
111
-
112
-
113
-
114
-
115
-
116
-
117
-
118
-
119
-
120
-
121
-
122
-
123
-
124
-
125
-
126
-
127
 |
 |

Table of Contents
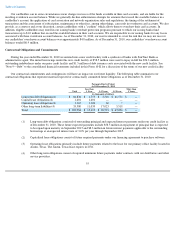
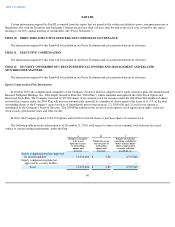
Operating Expenses
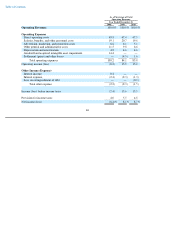
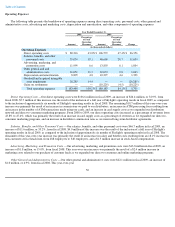
The following table presents the breakdown of operating expenses among direct operating costs, personnel costs, other general and
administrative costs, advertising and marketing costs, depreciation and amortization, and other components of operating expenses:
Direct Operating Costs —Our direct operating costs were $106.6 million in fiscal 2009, an increase of $26.4 million, or 32.9%, from
fiscal 2008. $7.7 million of this increase was the result of the inclusion of a full year of Skylight's operating results in fiscal 2009, as compared
to the inclusion of approximately six months of Skylight's operating results in fiscal 2008. The remaining $18.7 million of this year-over-year
increase was primarily the result of an increase in commissions we paid to our distributors, an increase in ATM processing fees resulting from
an increase in the number of ATM transactions made using our cards, and an increase in card supply costs as we expanded our distribution
network and direct-to-
consumer marketing programs. From 2008 to 2009, our direct operating costs increased as a percentage of revenues from
43.8% to 47.4%, which was primarily the result of an increase in card supply costs as a percentage of revenues as we expanded our direct-to-
consumer marketing programs, and an increase in distributor commission rates as we renewed long-term distributor agreements.
Salaries, Benefits, and Other Personnel Costs —Our salaries, benefits, and other personnel costs were $46.7 million in fiscal 2009, an
increase of $11.6 million, or 33.2%, from fiscal 2008. $4.0 million of this increase was the result of the inclusion of a full year of Skylight's
operating results in fiscal 2009, as compared to the inclusion of approximately six months of Skylight's operating results in fiscal 2008. The
remainder of this year-over-year increase was primarily the result of an increase in salary and benefit costs resulting from an 18.1% increase in
non-customer service headcount, from 288 employees to 340 employees, and a $1.5 million increase in stock-based compensation.
Advertising, Marketing, and Promotion Costs —Our advertising, marketing, and promotion costs were $13.8 million in fiscal 2009, an
increase of $1.8 million, or 15.0%, from fiscal 2008. This year-over-year increase was primarily the result of a $2.4 million increase in
marketing costs related to our purchase of customer leads as we expanded our direct-to-consumer and online marketing programs.
Other General and Administrative Costs —Our other general and administrative costs were $22.1 million in fiscal 2009, an increase of
$1.0 million, or 4.9%, from fiscal 2008. This year-over-year
50
Year Ended December 31,
2008 2009
Amount
Percentage
of Total
Operating
Revenues Amount
Percentage
of Total
Operating
Revenues Change
(in thousands of dollars)
Operating Expenses
Direct operating costs
$
80,216
43.8
%
$
106,572
47.4
%
$
26,356
Salaries, benefits, and other
personnel costs
35,034
19.1
46,668
20.7
11,634
Advertising, marketing, and
promotion costs
11,999
6.6
13,803
6.1
1,804
Other general and and
administrative costs
21,051
11.5
22,074
9.8
1,023
Depreciation and amortization
8,899
4.8
10,297
4.6
1,398
Goodwill and acquired intangible
asset impairment
26,285
14.4
—
—
(
26,285
)
Gains on settlements
—
—
(
10,229
)
(4.5
)
(10,229
)
Total operating expenses
$
183,484
100.2
%
$
189,185
84.1
%
$
5,701