NetSpend 2010 Annual Report Download - page 51
Download and view the complete annual report
Please find page 51 of the 2010 NetSpend annual report below. You can navigate through the pages in the report by either clicking on the pages listed below, or by using the keyword search tool below to find specific information within the annual report.-
 1
1 -
2
-
3
-
4
-
5
-
6
-
7
-
8
-
9
-
10
-
11
-
12
-
13
-
14
-
15
-
16
-
17
-
18
-
19
-
20
-
21
-
22
-
23
-
24
-
25
-
26
-
27
-
28
-
29
-
30
-
31
-
32
-
33
-
34
-
35
-
36
-
37
-
38
-
39
-
40
-
 41
41 -
 42
42 -
 43
43 -
 44
44 -
 45
45 -
 46
46 -
 47
47 -
 48
48 -
 49
49 -
 50
50 -
 51
51 -
 52
52 -
 53
53 -
 54
54 -
 55
55 -
 56
56 -
 57
57 -
 58
58 -
 59
59 -
 60
60 -
 61
61 -
62
-
63
-
64
-
65
-
66
-
67
-
68
-
69
-
70
-
71
-
72
-
73
-
74
-
75
-
76
-
77
-
78
-
79
-
80
-
81
-
82
-
83
-
84
-
85
-
86
-
87
-
88
-
89
-
90
-
91
-
92
-
93
-
94
-
95
-
96
-
97
-
98
-
99
-
100
-
101
-
102
-
103
-
104
-
105
-
106
-
107
-
108
-
109
-
110
-
111
-
112
-
113
-
114
-
115
-
116
-
117
-
118
-
119
-
120
-
121
-
122
-
123
-
124
-
125
-
126
-
127
 |
 |

Table of Contents
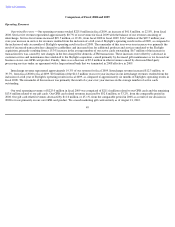
Comparison of Fiscal 2009 and 2010
Operating Revenues
Operating Revenues —Our operating revenues totaled $275.4 million in fiscal 2010, an increase of $50.4 million, or 22.4%, from fiscal
2009. Service fee revenue represented approximately 78.4% of our revenue for fiscal 2010 with the balance of our revenue consisting of
interchange. Service fee revenue increased $34.0 million, or 18.7%, from fiscal 2009 to fiscal 2010. This year-over-
year increase was primarily
the result of increased transaction fees charged to cardholders and increased fees for additional products and services, primarily resulting from
a 15.2% increase in the average number of our active cards outstanding and a 6.3% increase in the average service revenue per card, which was
largely driven by an increase in our direct deposit customer base.
Interchange revenue represented approximately 21.6% of our revenue for fiscal 2010. Interchange revenue increased $16.3 million, or
37.8%, from fiscal 2009 to fiscal 2010. This increase was primarily the result of a 29.6% year-over-year increase in our gross dollar volume,
combined with the negotiation of more favorable rates on some of our interchange revenue contracts.
Our total operating revenues of $275.4 million in fiscal 2010 was comprised of $269.1 million related to our GPR cards and the remaining
$6.3 million related to our gift cards. Our GPR card related revenues increased by $57.3 million, or 27.0%, from the comparable period in
2009. Our gift card related revenues decreased by $6.9 million, or 52.4%, from the comparable period in 2009 as a result of our decision in
2008 to focus primarily on our core GPR card product. We ceased marketing gift cards entirely as of August 21, 2010.
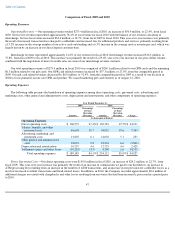
Operating Expenses
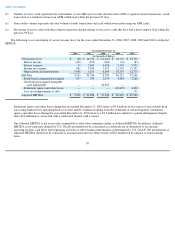
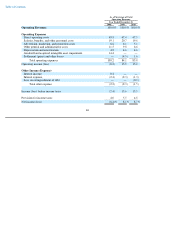
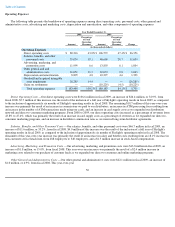
The following table presents the breakdown of operating expenses among direct operating costs, personnel costs, advertising and
marketing costs, other general and administrative costs, depreciation and amortization, and other components of operating expenses:
Direct Operating Costs —Our direct operating costs were $130.8 million in fiscal 2010, an increase of $24.2 million, or 22.7%, from
fiscal 2009. This year-over-year increase was primarily the result of an increase in commissions we paid to our distributors, an increase in
ATM processing fees resulting from an increase in the number of ATM transactions, and an increase in our provision for cardholder losses as a
result of increased overdraft transactions and fraud-related losses. In addition, in 2010, the Company recorded approximately $0.6 million of
additional charges associated with chargebacks and other losses resulting from recoveries that had been incorrectly processed in a period prior
to 2010.
47
Year Ended December 31,
2009 2010
Amount
Percentage
of Total
Operating
Revenues Amount
Percentage
of Total
Operating
Revenues Change
(in thousands of dollars)
Operating Expenses
Direct operating costs
$
106,572
47.4
%
$
130,783
47.5
%
$
24,211
Salaries, benefits, and other
personnel costs
46,668
20.7
54,032
19.6
7,364
Advertising, marketing, and
promotion costs
13,803
6.1
14,038
5.1
235
Other general and administrative
costs
22,074
9.8
18,234
6.6
(3,840
)
Depreciation and amortization
10,297
4.6
12,725
4.6
2,428
Settlement (gains) and other losses
(10,229
)
(4.5
)
4,300
1.6
14,529
Total operating expenses
$
189,185
84.1
%
$
234,112
85.0
%
$
44,927