NetSpend 2010 Annual Report Download - page 42
Download and view the complete annual report
Please find page 42 of the 2010 NetSpend annual report below. You can navigate through the pages in the report by either clicking on the pages listed below, or by using the keyword search tool below to find specific information within the annual report.-
 1
1 -
2
-
3
-
4
-
5
-
6
-
7
-
8
-
9
-
10
-
11
-
12
-
13
-
14
-
15
-
16
-
17
-
18
-
19
-
20
-
21
-
22
-
23
-
24
-
25
-
26
-
27
-
28
-
29
-
30
-
31
-
 32
32 -
 33
33 -
 34
34 -
 35
35 -
 36
36 -
 37
37 -
 38
38 -
 39
39 -
 40
40 -
 41
41 -
 42
42 -
 43
43 -
 44
44 -
 45
45 -
 46
46 -
 47
47 -
 48
48 -
 49
49 -
 50
50 -
 51
51 -
 52
52 -
53
-
54
-
55
-
56
-
57
-
58
-
59
-
60
-
61
-
62
-
63
-
64
-
65
-
66
-
67
-
68
-
69
-
70
-
71
-
72
-
73
-
74
-
75
-
76
-
77
-
78
-
79
-
80
-
81
-
82
-
83
-
84
-
85
-
86
-
87
-
88
-
89
-
90
-
91
-
92
-
93
-
94
-
95
-
96
-
97
-
98
-
99
-
100
-
101
-
102
-
103
-
104
-
105
-
106
-
107
-
108
-
109
-
110
-
111
-
112
-
113
-
114
-
115
-
116
-
117
-
118
-
119
-
120
-
121
-
122
-
123
-
124
-
125
-
126
-
127
 |
 |

Table of Contents
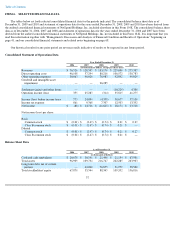
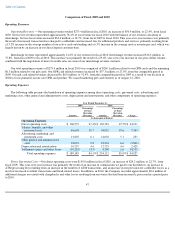
Other Financial and Operating Data
(1) We use a non-GAAP financial metric that we label "Adjusted EBITDA" to evaluate our financial performance. We compute Adjusted
EBITDA by adjusting net income or net loss to remove the effect of income and expenses related to interest, taxes, depreciation and
amortization ("EBITDA"), and then adjusting for stock-based compensation, and non-recurring gains and losses. We believe that
Adjusted EBITDA is an important metric for the following reasons:
• It provides a meaningful comparison of our operating results over several periods because it removes the impact of income and
expense items that are not a direct result of our core operations, such as goodwill and intangible impairments, legal settlements
and one-time settlement gains;
• We use it as a tool to assist in our planning for the effect of strategic operating decisions and for the prediction of future
operating results;
• It functioned as a threshold target for our company-wide employee bonus compensation; and we use it to evaluate our capacity
to incur and service debt, fund capital expenditures and expand our business.
(2) In addition to Adjusted EBITDA, we use a second non-GAAP financial metric that we label "Adjusted Net Income" to evaluate our
financial performance. We compute Adjusted Net Income by adjusting net income or net loss to remove tax-effected amortization
expense, stock-based compensation and other non-recurring gains and losses and we believe it is an important metric that is useful to
our board of directors, management and investors for the following reasons:
• Assets being depreciated will often have to be replaced in the future and Adjusted EBITDA does not reflect any expenditure for
these items;
• Adjusted EBITDA does not reflect the significant interest expense, or the payments necessary to service interest payments on
our debt;
• Adjusted Net Income provides a meaningful comparison of our operating results over several periods because it removes the
impact of income and expense items that are not a direct result of our core operations, such as goodwill and intangible
impairments, legal settlements and one-time settlement gains; and
• We believe Adjusted Net Income measurements are used by investors as a supplemental measure to evaluate the overall
operating performance of companies in our industry.
By providing these non-GAAP financial measures, together with the below reconciliations, we believe we are enhancing
investors' understanding of our business and our results of operations, as well as assisting investors in evaluating how well we
are executing strategic initiatives.
38
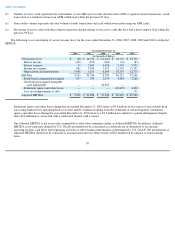
Year Ended December 31,
2006 2007 2008 2009 2010
(dollars in thousands)
(unaudited)
Adjusted EBITDA(1)
$
5,200
$
31,288
$
37,343
$
40,367
$
65,568
Adjusted net income(2)
$
(458
)
$
16,644
$
7,800
$
16,854
$
33,700
Number of active cards (at
period end)(3)
861,115
1,188,201
1,577,767
1,868,341
2,100,179
Gross dollar volume(4)
$
2,357,852
$
3,686,554
$
5,690,842
$
7,570,339
$
9,810,515
Percentage of direct
deposit active accounts
(5)
11.1
%
13.9
%
22.9
%
27.6
%
34.2
%