NetSpend 2010 Annual Report Download - page 56
Download and view the complete annual report
Please find page 56 of the 2010 NetSpend annual report below. You can navigate through the pages in the report by either clicking on the pages listed below, or by using the keyword search tool below to find specific information within the annual report.-
 1
1 -
2
-
3
-
4
-
5
-
6
-
7
-
8
-
9
-
10
-
11
-
12
-
13
-
14
-
15
-
16
-
17
-
18
-
19
-
20
-
21
-
22
-
23
-
24
-
25
-
26
-
27
-
28
-
29
-
30
-
31
-
32
-
33
-
34
-
35
-
36
-
37
-
38
-
39
-
40
-
41
-
42
-
43
-
44
-
45
-
 46
46 -
 47
47 -
 48
48 -
 49
49 -
 50
50 -
 51
51 -
 52
52 -
 53
53 -
 54
54 -
 55
55 -
 56
56 -
 57
57 -
 58
58 -
 59
59 -
 60
60 -
 61
61 -
 62
62 -
 63
63 -
 64
64 -
 65
65 -
 66
66 -
67
-
68
-
69
-
70
-
71
-
72
-
73
-
74
-
75
-
76
-
77
-
78
-
79
-
80
-
81
-
82
-
83
-
84
-
85
-
86
-
87
-
88
-
89
-
90
-
91
-
92
-
93
-
94
-
95
-
96
-
97
-
98
-
99
-
100
-
101
-
102
-
103
-
104
-
105
-
106
-
107
-
108
-
109
-
110
-
111
-
112
-
113
-
114
-
115
-
116
-
117
-
118
-
119
-
120
-
121
-
122
-
123
-
124
-
125
-
126
-
127
 |
 |

Table of Contents
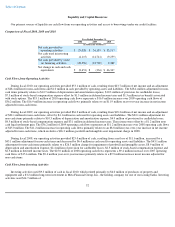
Liquidity and Capital Resources
Our primary sources of liquidity are cash flow from our operating activities and access to borrowings under our credit facilities.
Comparison of Fiscal 2008, 2009 and 2010
Cash Flows from Operating Activities
During fiscal 2010, our operating activities provided $53.1 million of cash, resulting from $23.7 million of net income and an adjustment
of $28.4 million for non-cash items and $1.0 million in cash provided by operating assets and liabilities. The $28.4 million adjustment for non-
cash items primarily relates to $12.7 million of depreciation and amortization expense, $10.3 million of provision for cardholder losses,
$7.3 million of stock-based compensation expense offset by $1.5 million in deferred income taxes and $1.5 million in tax benefit associated
with stock options. The $53.1 million of 2010 operating cash flows represents a $16.9 million increase over 2009 operating cash flows of
$36.2 million. The $16.9 million increase in operating cash flows primarily relates to an $11.9 million year-over-year increase in net income
adjusted for non-cash items.
During fiscal 2009, our operating activities provided $36.2 million of cash, resulting from $18.2 million of net income and an adjustment
of $22.1 million for non-cash items, offset by $4.1 million in cash used for operating assets and liabilities. The $22.1 million adjustment for
non-cash items primarily relates to $10.3 million of depreciation and amortization expense, $4.9 million of provision for cardholder losses,
$4.5 million of stock-based compensation expense and $3.1 million in deferred income taxes. These items were offset by a $1.2 million non-
cash legal settlement gain. The $36.2 million of 2009 operating cash flows represents an $11.2 million increase over 2008 operating cash flows
of $25.0 million. The $11.2 million increase in operating cash flows primarily relates to an $8.8 million year-over-year increase in net income
adjusted for non-cash items, which excludes a $26.3 million goodwill and intangible asset impairment charge in 2008.
During fiscal 2008, our operating activities provided $25.0 million of cash, resulting from a net loss of $11.6 million, increased by a
$43.1 million adjustment for non-cash items and decreased by $6.4 million in cash used for operating assets and liabilities. The $43.1 million
adjustment for non-cash items primarily relates to a $26.3 million charge for impairment of goodwill and intangible assets, $8.9 million of
depreciation and amortization expense, $2.4 million of provision for cardholder losses, $2.5 million of stock-based compensation expense and
$2.5 million in deferred income taxes. The $25.0 million of 2008 operating cash flows represents a $9.4 million increase over 2007 operating
cash flows of $15.6 million. The $9.4 million year-over-year increase primarily relates to a $9.9 million increase in net income adjusted for
non-cash items.
Cash Flows from Investing Activities
Investing activities used $9.3 million of cash in fiscal 2010, which related primarily to $6.0 million of purchases of property and
equipment and a $3.2 million long-term investment in Meta Financial Group, Inc., the holding company for one of our issuing banks. Investing
activities used $14.7 million of
52
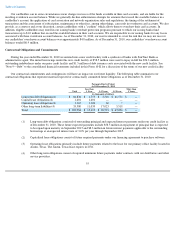
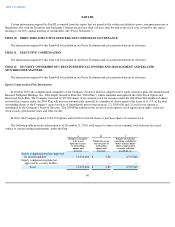
Year Ended December 31,
2008 2009 2010
(in thousands of dollars)
Net cash provided by
operating activities
$
25,020
$
36,195
$
53,117
Net cash used in investing
activities
(4,115
)
(14,741
)
(9,259
)
Net cash provided by (used
in) financing activities
(29,556
)
(21,790
)
2,489
Net change in cash and cash
equivalents
$
(8,651
)
$
(336
)
$
46,347