NetSpend 2010 Annual Report Download - page 43
Download and view the complete annual report
Please find page 43 of the 2010 NetSpend annual report below. You can navigate through the pages in the report by either clicking on the pages listed below, or by using the keyword search tool below to find specific information within the annual report.-
 1
1 -
2
-
3
-
4
-
5
-
6
-
7
-
8
-
9
-
10
-
11
-
12
-
13
-
14
-
15
-
16
-
17
-
18
-
19
-
20
-
21
-
22
-
23
-
24
-
25
-
26
-
27
-
28
-
29
-
30
-
31
-
32
-
 33
33 -
 34
34 -
 35
35 -
 36
36 -
 37
37 -
 38
38 -
 39
39 -
 40
40 -
 41
41 -
 42
42 -
 43
43 -
 44
44 -
 45
45 -
 46
46 -
 47
47 -
 48
48 -
 49
49 -
 50
50 -
 51
51 -
 52
52 -
 53
53 -
54
-
55
-
56
-
57
-
58
-
59
-
60
-
61
-
62
-
63
-
64
-
65
-
66
-
67
-
68
-
69
-
70
-
71
-
72
-
73
-
74
-
75
-
76
-
77
-
78
-
79
-
80
-
81
-
82
-
83
-
84
-
85
-
86
-
87
-
88
-
89
-
90
-
91
-
92
-
93
-
94
-
95
-
96
-
97
-
98
-
99
-
100
-
101
-
102
-
103
-
104
-
105
-
106
-
107
-
108
-
109
-
110
-
111
-
112
-
113
-
114
-
115
-
116
-
117
-
118
-
119
-
120
-
121
-
122
-
123
-
124
-
125
-
126
-
127
 |
 |

Table of Contents
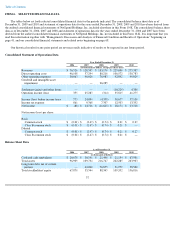
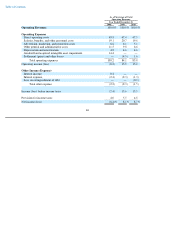
(3) Number of active cards represents the total number of our GPR card accounts that have had a PIN or signature-based transaction, a load
transaction at a retailer location or an ATM withdrawal within the previous 90 days.
(4) Gross dollar volume represents the total volume of debit transactions and cash withdrawals made using our GPR cards.
(5)
Percentage of active cards with direct deposit represents the percentage of our active cards that have had a direct deposit load within the
previous 90 days.
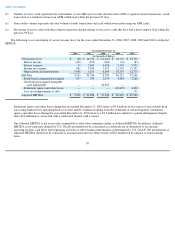
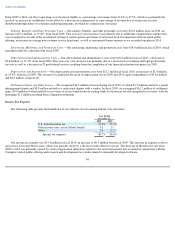
The following is a reconciliation of our net income (loss) for the years ended December 31, 2006, 2007, 2008, 2009 and 2010 to Adjusted
EBITDA.
Settlement (gains) and other losses during the year ended December 31, 2009 relate to $9.0 million of recoveries of excess funds from
our issuing banks for fee and chargeback recoveries and $1.2 million resulting from the settlement of certain litigation. Settlement
(gains) and other losses during the year ended December 31, 2010 relate to a $3.5 million loss related to a patent infringement dispute
and a $0.8 million loss associated with a contractual dispute with a vendor.
Our Adjusted EBITDA is not necessarily comparable to what other companies define as Adjusted EBITDA. In addition, Adjusted
EBITDA is not a measure defined by U.S. GAAP and should not be considered as a substitute for or alternative to net income,
operating income, cash flows from operating activities or other financial information as determined by U.S. GAAP. Our presentation of
Adjusted EBITDA should not be construed as an implication that our future results will be unaffected by unusual or non-recurring
items.
39
Year Ended December 31,
2006 2007 2008 2009 2010
(in thousands of dollars)
Net income (loss)
$
(88
)
$
14,726
$
(11,645
)
$
18,174
$
23,748
Interest income
(452
)
(876
)
(384
)
(32
)
(85
)
Interest expense
34
2,065
4,408
5,170
3,526
Income tax expense
861
9,368
7,307
12,503
13,352
Depreciation and amortization
3,988
5,251
8,899
10,297
12,725
EBITDA
4,343
30,534
8,585
46,112
53,266
Stock
-
based compensation expense
857
754
2,473
4,484
7,268
Goodwill and acquired intangible
asset impairment
—
—
26,285
—
—
Settlement (gains) and other losses
—
—
—
(
10,229
)
4,300
Loss on extinguishment of debt
—
—
—
—
734
Adjusted EBITDA
$
5,200
$
31,288
$
37,343
$
40,367
$
65,568