NetSpend 2010 Annual Report Download - page 76
Download and view the complete annual report
Please find page 76 of the 2010 NetSpend annual report below. You can navigate through the pages in the report by either clicking on the pages listed below, or by using the keyword search tool below to find specific information within the annual report.-
 1
1 -
2
-
3
-
4
-
5
-
6
-
7
-
8
-
9
-
10
-
11
-
12
-
13
-
14
-
15
-
16
-
17
-
18
-
19
-
20
-
21
-
22
-
23
-
24
-
25
-
26
-
27
-
28
-
29
-
30
-
31
-
32
-
33
-
34
-
35
-
36
-
37
-
38
-
39
-
40
-
41
-
42
-
43
-
44
-
45
-
46
-
47
-
48
-
49
-
50
-
51
-
52
-
53
-
54
-
55
-
56
-
57
-
58
-
59
-
60
-
61
-
62
-
63
-
64
-
65
-
 66
66 -
 67
67 -
 68
68 -
 69
69 -
 70
70 -
 71
71 -
 72
72 -
 73
73 -
 74
74 -
 75
75 -
 76
76 -
 77
77 -
 78
78 -
 79
79 -
 80
80 -
 81
81 -
 82
82 -
 83
83 -
 84
84 -
 85
85 -
 86
86 -
87
-
88
-
89
-
90
-
91
-
92
-
93
-
94
-
95
-
96
-
97
-
98
-
99
-
100
-
101
-
102
-
103
-
104
-
105
-
106
-
107
-
108
-
109
-
110
-
111
-
112
-
113
-
114
-
115
-
116
-
117
-
118
-
119
-
120
-
121
-
122
-
123
-
124
-
125
-
126
-
127
 |
 |

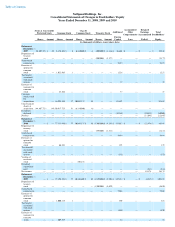
70
Vesting of
restricted
stock
—
—
—
215,050
1
—
—
—
—
—
1
Common
stock issued
in public
offering,
net of
issuance
costs
(Note 11)
—
—
2,272,727
2
—
—
—
—
20,979
—
—
20,981
Conversion of
Class B
common
stock to
common
stock
—
—
10,459,659
11
(10,459,659
)
(11
)
—
—
—
—
—
—
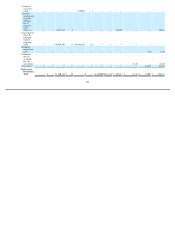
Dividend
equivalents
paid
—
—
—
—
—
—
—
—
—
—
(
176
)
(176
)
Unrealized
loss on
available-
for-sale
investment
—
—
—
—
—
—
—
—
—
(
1,142
)
—
(
1,142
)
Net income
—
—
—
—
—
—
—
—
—
—
23,748
23,748
Balances at
December 31,
2010
—
$
—
91,540,381
$
92
—
$
—
(
3,370,000
)
$
(11,374
)
$
150,183
$
(1,142
)
$
19,057
$
156,816