NetSpend 2010 Annual Report Download - page 41
Download and view the complete annual report
Please find page 41 of the 2010 NetSpend annual report below. You can navigate through the pages in the report by either clicking on the pages listed below, or by using the keyword search tool below to find specific information within the annual report.-
 1
1 -
2
-
3
-
4
-
5
-
6
-
7
-
8
-
9
-
10
-
11
-
12
-
13
-
14
-
15
-
16
-
17
-
18
-
19
-
20
-
21
-
22
-
23
-
24
-
25
-
26
-
27
-
28
-
29
-
30
-
 31
31 -
 32
32 -
 33
33 -
 34
34 -
 35
35 -
 36
36 -
 37
37 -
 38
38 -
 39
39 -
 40
40 -
 41
41 -
 42
42 -
 43
43 -
 44
44 -
 45
45 -
 46
46 -
 47
47 -
 48
48 -
 49
49 -
 50
50 -
 51
51 -
52
-
53
-
54
-
55
-
56
-
57
-
58
-
59
-
60
-
61
-
62
-
63
-
64
-
65
-
66
-
67
-
68
-
69
-
70
-
71
-
72
-
73
-
74
-
75
-
76
-
77
-
78
-
79
-
80
-
81
-
82
-
83
-
84
-
85
-
86
-
87
-
88
-
89
-
90
-
91
-
92
-
93
-
94
-
95
-
96
-
97
-
98
-
99
-
100
-
101
-
102
-
103
-
104
-
105
-
106
-
107
-
108
-
109
-
110
-
111
-
112
-
113
-
114
-
115
-
116
-
117
-
118
-
119
-
120
-
121
-
122
-
123
-
124
-
125
-
126
-
127
 |
 |

Table of Contents
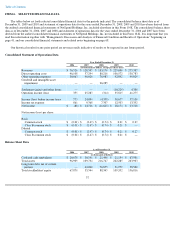
ITEM 6. SELECTED FINANCIAL DATA
The tables below set forth selected consolidated financial data for the periods indicated. The consolidated balance sheet data as of
December 31, 2009 and 2010 and statement of operations data for the years ended December 31, 2008, 2009 and 2010 have been derived from
the audited consolidated financial statements of NetSpend Holdings, Inc. included elsewhere in this Form 10-
K. The consolidated balance sheet
data as of December 31, 2006, 2007 and 2008 and statement of operations data for the years ended December 31, 2006 and 2007 have been
derived from the audited consolidated financial statements of NetSpend Holdings, Inc. not included in this Form 10-K. It is important that you
read this information together with "Management's Discussion and Analysis of Financial Condition and Results of Operations" beginning on
page 41, and our consolidated financial statements and related notes beginning on page 68.
Our historical results for any prior period are not necessarily indicative of results to be expected in any future period.
Consolidated Statement of Operations Data
Balance Sheet Data
37
Year Ended December 31,
2006 2007 2008 2009 2010
(in thousands of dollars, except per share data)
Revenues
$
76,526
$
128,597
$
183,170
$
225,000
$
275,387
Direct operating costs
46,108
57,294
80,216
106,572
130,783
Other operating expenses
30,063
46,020
76,983
92,842
99,029
Goodwill and intangible asset
impairment
—
—
26,285
—
—
Settlement (gains) and other losses
—
—
—
(
10,229
)
4,300
Operating income (loss)
355
25,283
(314
)
35,815
41,275
Income (loss) before income taxes
773
24,094
(4,338
)
30,677
37,100
Income tax expense
861
9,368
7,307
12,503
13,352
Net income
$
(88
)
$
14,726
$
(11,645
)
$
18,174
$
23,748
Net income (loss) per share:
Basic
Common stock
$
(0.01
)
$
(2.47
)
$
(0.74
)
$
0.21
$
0.27
Class B common stock
$
(0.01
)
$
(2.47
)
$
(0.74
)
$
0.21
$
—
Diluted
Common stock
$
(0.01
)
$
(2.47
)
$
(0.74
)
$
0.21
$
0.27
Class B common stock
$
(0.01
)
$
(2.47
)
$
(0.74
)
$
0.21
$
—
As of December 31,
2006 2007 2008 2009 2010
(in thousands of dollars)
Cash and cash equivalents
$
20,678
$
30,141
$
21,490
$
21,154
$
67,501
Total assets
96,909
109,734
216,747
222,285
263,903
Long-term debt, net of current
portion
—
42,000
76,875
51,979
58,500
Total stockholders' equity
67,870
35,544
88,345
109,352
156,816