Motorola 2009 Annual Report Download - page 99
Download and view the complete annual report
Please find page 99 of the 2009 Motorola annual report below. You can navigate through the pages in the report by either clicking on the pages listed below, or by using the keyword search tool below to find specific information within the annual report.-
 1
1 -
2
-
3
-
4
-
5
-
6
-
7
-
8
-
9
-
10
-
11
-
12
-
13
-
14
-
15
-
16
-
17
-
18
-
19
-
20
-
21
-
22
-
23
-
24
-
25
-
26
-
27
-
28
-
29
-
30
-
31
-
32
-
33
-
34
-
35
-
36
-
37
-
38
-
39
-
40
-
41
-
42
-
43
-
44
-
45
-
46
-
47
-
48
-
49
-
50
-
51
-
52
-
53
-
54
-
55
-
56
-
57
-
58
-
59
-
60
-
61
-
62
-
63
-
64
-
65
-
66
-
67
-
68
-
69
-
70
-
71
-
72
-
73
-
74
-
75
-
76
-
77
-
78
-
79
-
80
-
81
-
82
-
83
-
84
-
85
-
86
-
87
-
88
-
 89
89 -
 90
90 -
 91
91 -
 92
92 -
 93
93 -
 94
94 -
 95
95 -
 96
96 -
 97
97 -
 98
98 -
 99
99 -
 100
100 -
 101
101 -
 102
102 -
 103
103 -
 104
104 -
 105
105 -
 106
106 -
 107
107 -
 108
108 -
 109
109 -
110
-
111
-
112
-
113
-
114
-
115
-
116
-
117
-
118
-
119
-
120
-
121
-
122
-
123
-
124
-
125
-
126
-
127
-
128
-
129
-
130
-
131
-
132
-
133
-
134
-
135
-
136
-
137
-
138
-
139
-
140
-
141
-
142
-
143
-
144
-
145
-
146
-
147
-
148
-
149
-
150
-
151
-
152
 |
 |

91
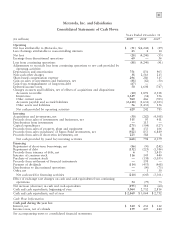
During the year ended December 31, 2009, the $88 million of net gains primarily relates to sales of certain
of the Company’s equity investments, of which $32 million of gain was attributable to a single investment. These
gains were partially offset by a net loss on the sale of specific businesses. During the year ended December 31,
2008, the $82 million of net gains primarily related to sales of a number of the Company’s equity investments, of
which $29 million of gain was attributable to a single investment. During the year ended December 31, 2007, the
$50 million of net gains was primarily related to a $34 million gain on the sale of the Company’s embedded
communication computing group.
Accounts Receivable
Accounts receivable, net, consists of the following:
December 31 2009 2008
Accounts receivable $3,637 $3,675
Less allowance for doubtful accounts (142) (182)
$3,495 $3,493
Inventories
Inventories, net, consist of the following:
December 31 2009 2008
Finished goods $1,062 $1,710
Work-in-process and production materials 1,062 1,709
2,124 3,419
Less inventory reserves (816) (760)
$1,308 $2,659
During the year ended December 31, 2008, the Company recorded a charge of $291 million for excess
inventory due to a decision to consolidate software and silicon platforms in the Mobile Devices segment.
Other Current Assets
Other current assets consists of the following:
December 31 2009 2008
Costs and earnings in excess of billings $ 686 $1,094
Contract related deferred costs 616 861
Contractor receivables 342 378
Value-added tax refunds receivable 95 278
Other 445 529
$2,184 $3,140
Property, plant, and equipment
Property, plant and equipment, net, consists of the following:
December 31 2009 2008
Land $ 127 $ 148
Building 1,823 1,905
Machinery and equipment 5,187 5,687
7,137 7,740
Less accumulated depreciation (4,983) (5,298)
$ 2,154 $ 2,442
Depreciation expense for the years ended December 31, 2009, 2008 and 2007 was $471 million,
$511 million and $537 million, respectively.