Motorola 2009 Annual Report Download - page 51
Download and view the complete annual report
Please find page 51 of the 2009 Motorola annual report below. You can navigate through the pages in the report by either clicking on the pages listed below, or by using the keyword search tool below to find specific information within the annual report.
43
MANAGEMENT’S DISCUSSION AND ANALYSIS
OF FINANCIAL CONDITION AND RESULTS OF OPERATIONS
Loss from Continuing Operations
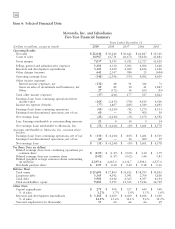
The Company incurred a net loss from continuing operations before income taxes of $165 million in 2009,
compared with a net loss from continuing operations before income taxes of $2.6 billion in 2008. After taxes,
and excluding Earnings attributable to noncontrolling interests, the Company incurred a net loss from continuing
operations of $111 million, or $0.05 per diluted share, in 2009, compared to a net loss from continuing
operations of $4.2 billion, or $1.87 per diluted share, in 2008.
The improvement in the loss from continuing operations before income taxes in 2009 compared to 2008 was
primarily attributed to: (i) a $1.7 billion decrease in Other charges, (ii) a $949 million decrease in SG&A
expenses, (iii) a $926 million decrease in R&D expenditures, (iv) a $399 million increase in income classified as
Other, as presented in Other income (expense), and (v) a $6 million increase in gains on the sale of investments
and businesses. These factors were partially offset by: (i) a $1.3 billion decrease in gross margin, and (ii) a
$180 million increase in net interest expense.
Earnings from Discontinued Operations
During the first quarter of 2009, the Company completed the sales of: (i) Good Technology, and (ii) the
Company’s former biometrics business unit, which included its Printrak trademark. After taxes, the Company had
earnings from discontinued operations of $60 million, or $0.03 per diluted share, in 2009, all of which occurred
during the first quarter of 2009. The Company had no such activity during the last nine months of 2009. For all
other applicable prior periods, the operating results of these businesses have not been reclassified as discontinued
operations, since the results are not material to the Company’s consolidated financial statements.
Results of Operations—2008 Compared to 2007
Net Sales
Net sales were $30.1 billion in 2008, down 18% compared to net sales of $36.6 billion in 2007. The
decrease in net sales reflected a $6.9 billion, or 36%, decrease in net sales in the Mobile Devices segment,
partially offset by: (i) a $364 million, or 5%, increase in net sales in the Enterprise Mobility Solutions segment,
and (ii) a $72 million, or 1%, increase in net sales in the Home and Networks Mobility segment. The 36%
decrease in net sales in the Mobile Devices segment was primarily driven by a 37% decrease in unit shipments.
The 5% increase in the Enterprise Mobility Solutions segment net sales reflected an 8% increase in net sales to
the government and public safety market, partially offset by a 2% decrease in net sales to the commercial
enterprise market. The 1% increase in net sales in the Home and Networks Mobility segment reflected a 16%
increase in net sales in the home business, partially offset by an 11% decrease in net sales in the networks
business.
Gross Margin
Gross margin was $8.4 billion, or 27.8% of net sales, in 2008, compared to $10.0 billion, or 27.2% of net
sales, in 2007. The decrease in gross margin reflected lower gross margin in the Mobile Devices and Home and
Networks Mobility segments, partially offset by increased gross margin in the Enterprise Mobility Solutions
segment. The decrease in gross margin in the Mobile Devices segment was primarily driven by: (i) the 36%
decrease in net sales, (ii) excess inventory and other related charges of $370 million recorded in 2008 due to a
decision to consolidate software and silicon platforms, and (iii) a $150 million charge recorded in 2008 related to
the settlement of a purchase commitment, partially offset by: (i) the absence in 2008 of a $277 million charge for
a legal settlement recorded in 2007, and (ii) savings from supply chain cost-reduction activities. The decrease in
gross margin in the Home and Networks Mobility segment was primarily due to: (i) an unfavorable product mix,
and (ii) the absence of net sales by the Company’s former embedded communications computing group (‘‘ECC’’)
that was divested at the end of 2007. The increase in gross margin in the Enterprise Mobility Solutions segment
was primarily driven by: (i) the 5% increase in net sales, (ii) a favorable product mix, and (iii) the absence in
2008 of an inventory-related charge in connection with the acquisition of Symbol during the first quarter of
2007.
The increase in gross margin as a percentage of net sales in 2008 compared to 2007 was driven by an
increase in gross margin percentage in the Enterprise Mobility Solutions segment, partially offset by a decrease in
gross margin percentage in the Mobile Devices and Home and Networks Mobility segments.


