Motorola 2009 Annual Report Download - page 43
Download and view the complete annual report
Please find page 43 of the 2009 Motorola annual report below. You can navigate through the pages in the report by either clicking on the pages listed below, or by using the keyword search tool below to find specific information within the annual report.-
 1
1 -
2
-
3
-
4
-
5
-
6
-
7
-
8
-
9
-
10
-
11
-
12
-
13
-
14
-
15
-
16
-
17
-
18
-
19
-
20
-
21
-
22
-
23
-
24
-
25
-
26
-
27
-
28
-
29
-
30
-
31
-
32
-
 33
33 -
 34
34 -
 35
35 -
 36
36 -
 37
37 -
 38
38 -
 39
39 -
 40
40 -
 41
41 -
 42
42 -
 43
43 -
 44
44 -
 45
45 -
 46
46 -
 47
47 -
 48
48 -
 49
49 -
 50
50 -
 51
51 -
 52
52 -
 53
53 -
54
-
55
-
56
-
57
-
58
-
59
-
60
-
61
-
62
-
63
-
64
-
65
-
66
-
67
-
68
-
69
-
70
-
71
-
72
-
73
-
74
-
75
-
76
-
77
-
78
-
79
-
80
-
81
-
82
-
83
-
84
-
85
-
86
-
87
-
88
-
89
-
90
-
91
-
92
-
93
-
94
-
95
-
96
-
97
-
98
-
99
-
100
-
101
-
102
-
103
-
104
-
105
-
106
-
107
-
108
-
109
-
110
-
111
-
112
-
113
-
114
-
115
-
116
-
117
-
118
-
119
-
120
-
121
-
122
-
123
-
124
-
125
-
126
-
127
-
128
-
129
-
130
-
131
-
132
-
133
-
134
-
135
-
136
-
137
-
138
-
139
-
140
-
141
-
142
-
143
-
144
-
145
-
146
-
147
-
148
-
149
-
150
-
151
-
152
 |
 |

35
MANAGEMENT’S DISCUSSION AND ANALYSIS
OF FINANCIAL CONDITION AND RESULTS OF OPERATIONS
Item 7: Management’s Discussion and Analysis of Financial Condition and Results of
Operations
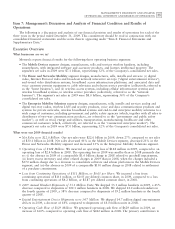
The following is a discussion and analysis of our financial position and results of operations for each of the
three years in the period ended December 31, 2009. This commentary should be read in conjunction with our
consolidated financial statements and the notes thereto appearing under ‘‘Item 8: Financial Statements and
Supplementary Data.’’
Executive Overview
What businesses are we in?
Motorola reports financial results for the following three operating business segments:
• The Mobile Devices segment designs, manufactures, sells and services wireless handsets, including
smartphones, with integrated software and accessory products, and licenses intellectual property. The
segment’s net sales in 2009 were $7.1 billion, representing 32% of the Company’s consolidated net sales.
• The Home and Networks Mobility segment designs, manufactures, sells, installs and services: (i) digital
video, Internet Protocol video and broadcast network interactive set-tops (‘‘digital entertainment devices’’),
end-to-end video distribution systems, broadband access infrastructure platforms, and associated data and
voice customer premise equipment to cable television and telecom service providers (collectively, referred to
as the ‘‘home business’’), and (ii) wireless access systems, including cellular infrastructure systems and
wireless broadband systems, to wireless service providers (collectively, referred to as the ‘‘network
business’’). The segment’s net sales in 2009 were $8.0 billion, representing 36% of the Company’s
consolidated net sales.
• The Enterprise Mobility Solutions segment designs, manufactures, sells, installs and services analog and
digital two-way radios, wireless LAN and security products, voice and data communications products and
systems for private networks, wireless broadband systems and end-to-end enterprise mobility solutions to a
wide range of customers, including government and public safety agencies (which, together with all sales to
distributors of two-way communication products, are referred to as the ‘‘government and public safety
market’’), as well as retail, energy and utilities, transportation, manufacturing, healthcare and other
commercial customers (which, collectively, are referred to as the ‘‘commercial enterprise market’’). The
segment’s net sales in 2009 were $7.0 billion, representing 32% of the Company’s consolidated net sales.
What were our 2009 financial results?
•Net Sales were $22.0 Billion: Our net sales were $22.0 billion in 2009, down 27% compared to net sales
of $30.1 billion in 2008. Net sales decreased 41% in the Mobile Devices segment, decreased 21% in the
Home and Networks Mobility segment and decreased 13% in the Enterprise Mobility Solutions segment.
•Operating Loss of $148 Million: We incurred an operating loss of $148 million in 2009, compared to an
operating loss of $2.4 billion in 2008. The operating loss in 2009 was smaller than in 2008 primarily due
to: (i) the absence in 2009 of a comparable $1.6 billion charge in 2008 related to goodwill impairments,
(ii) lower excess inventory and other related charges in 2009 than in 2008, when the charges included a
$370 million charge due to a decision to consolidate software and silicon platforms in the Mobile Devices
segment, and (iii) the absence in 2009 of a comparable $150 million charge in 2008 related to settlement
of a purchase commitment.
•Loss from Continuing Operations of $111 Million, or $0.05 per Share: We incurred a loss from
continuing operations of $111 million, or $0.05 per diluted common share, in 2009, compared to a loss
from continuing operations of $4.2 billion, or $1.87 per diluted common share, in 2008.
•2009 Annual Handset Shipments of 55.1 Million Units: We shipped 55.1 million handsets in 2009, a 45%
decrease compared to shipments of 100.1 million handsets in 2008. We shipped 12.0 million handsets in
the fourth quarter of 2009, a 38% decrease compared to shipments of 19.2 million handsets in the fourth
quarter of 2008.
•Digital Entertainment Device Shipments were 14.7 Million: We shipped 14.7 million digital entertainment
devices in 2009, a decrease of 18% compared to shipments of 18.0 million units in 2008.
•Operating Cash Flow of $629 Million: We generated operating cash flow of $629 million in 2009, an
increase of 160% compared to operating cash flow of $242 million in 2008. The primary contributors to