Motorola 2009 Annual Report Download - page 48
Download and view the complete annual report
Please find page 48 of the 2009 Motorola annual report below. You can navigate through the pages in the report by either clicking on the pages listed below, or by using the keyword search tool below to find specific information within the annual report.-
 1
1 -
2
-
3
-
4
-
5
-
6
-
7
-
8
-
9
-
10
-
11
-
12
-
13
-
14
-
15
-
16
-
17
-
18
-
19
-
20
-
21
-
22
-
23
-
24
-
25
-
26
-
27
-
28
-
29
-
30
-
31
-
32
-
33
-
34
-
35
-
36
-
37
-
 38
38 -
 39
39 -
 40
40 -
 41
41 -
 42
42 -
 43
43 -
 44
44 -
 45
45 -
 46
46 -
 47
47 -
 48
48 -
 49
49 -
 50
50 -
 51
51 -
 52
52 -
 53
53 -
 54
54 -
 55
55 -
 56
56 -
 57
57 -
 58
58 -
59
-
60
-
61
-
62
-
63
-
64
-
65
-
66
-
67
-
68
-
69
-
70
-
71
-
72
-
73
-
74
-
75
-
76
-
77
-
78
-
79
-
80
-
81
-
82
-
83
-
84
-
85
-
86
-
87
-
88
-
89
-
90
-
91
-
92
-
93
-
94
-
95
-
96
-
97
-
98
-
99
-
100
-
101
-
102
-
103
-
104
-
105
-
106
-
107
-
108
-
109
-
110
-
111
-
112
-
113
-
114
-
115
-
116
-
117
-
118
-
119
-
120
-
121
-
122
-
123
-
124
-
125
-
126
-
127
-
128
-
129
-
130
-
131
-
132
-
133
-
134
-
135
-
136
-
137
-
138
-
139
-
140
-
141
-
142
-
143
-
144
-
145
-
146
-
147
-
148
-
149
-
150
-
151
-
152
 |
 |

40 MANAGEMENT’S DISCUSSION AND ANALYSIS
OF FINANCIAL CONDITION AND RESULTS OF OPERATIONS
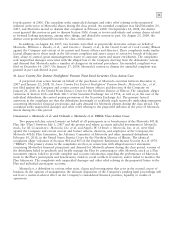
will be capitalized in a manner that will achieve an investment grade rating and will be the entity responsible for
Motorola’s outstanding public market debt at the time of separation. Following the separation, both entities will
use the Motorola brand. The Mobile Devices and Home business is expected to own the Motorola brand and
license it royalty free to the Enterprise Mobility Solutions and Networks business. Completion of the separation is
subject to a number of conditions. There can be no assurance that any separation transaction will ultimately
occur or, if one does occur, there can be no assurances as to its terms or timing.
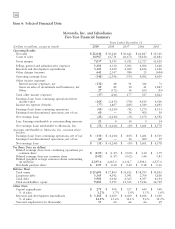
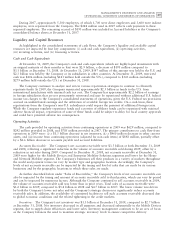
Results of Operations
Years Ended December 31
% of % of % of
(Dollars in millions, except per share amounts) 2009 sales 2008 sales 2007 sales
Net sales $22,044 $30,146 $36,622
Costs of sales 14,987 68.0% 21,751 72.2% 26,670 72.8%
Gross margin 7,057 32.0% 8,395 27.8% 9,952 27.2%
Selling, general and administrative expenses 3,381 15.3% 4,330 14.4% 5,092 13.9%
Research and development expenditures 3,183 14.4% 4,109 13.6% 4,429 12.1%
Other charges 641 3.0% 2,347 7.7% 984 2.7%
Operating loss (148) (0.7)% (2,391) (7.9)% (553) (1.5)%
Other income (expense):
Interest income (expense), net (132) (0.6)% 48 0.1% 91 0.2%
Gains on sales of investments and businesses, net 88 0.4% 82 0.3% 50 0.1%
Other 27 0.1% (372) (1.2)% 36 0.1%
Total other income (expense) (17) (0.1)% (242) (0.8)% 177 0.4%
Loss from continuing operations before income
taxes (165) (0.7% (2,633) (8.7)% (376) (1.1)%
Income tax expense (benefit) (77) (0.3)% 1,607 5.4% (285) (0.8)%
(88) (0.4)% (4,240) (14.1)% (91) (0.3)%
Less: Earnings attributable to noncontrolling
interests 23 0.1% 4 0.0% 14 0.0%
Loss from continuing operations* (111) (0.5)% (4,244) (14.1)% (105) (0.3)%
Earnings from discontinued operations, net of tax 60 0.3% — 0.0% 56 0.2%
Net loss* $ (51) (0.2)% $ (4,244) (14.1)% $ (49) (0.1)%
Earnings (loss) per diluted common share:
Continuing operations $ (0.05) $ (1.87) $ (0.05)
Discontinued operations 0.03 — 0.03
$ (0.02) $ (1.87) $ (0.02)
* Amounts attributable to Motorola, Inc. common shareholders.
Geographic market sales measured by the locale of the end customer as a percent of total net sales for 2009,
2008 and 2007 are as follows:
Geographic Market Sales by Locale of End Customer
2009 2008 2007
United States 54% 49% 51%
Latin America 11% 14% 12%
Asia, excluding China 11% 10% 9%
Europe 9% 13% 13%
China 6% 7% 7%
Other Markets 9% 7% 8%
100% 100% 100%