Motorola 2009 Annual Report Download - page 52
Download and view the complete annual report
Please find page 52 of the 2009 Motorola annual report below. You can navigate through the pages in the report by either clicking on the pages listed below, or by using the keyword search tool below to find specific information within the annual report.-
 1
1 -
2
-
3
-
4
-
5
-
6
-
7
-
8
-
9
-
10
-
11
-
12
-
13
-
14
-
15
-
16
-
17
-
18
-
19
-
20
-
21
-
22
-
23
-
24
-
25
-
26
-
27
-
28
-
29
-
30
-
31
-
32
-
33
-
34
-
35
-
36
-
37
-
38
-
39
-
40
-
41
-
 42
42 -
 43
43 -
 44
44 -
 45
45 -
 46
46 -
 47
47 -
 48
48 -
 49
49 -
 50
50 -
 51
51 -
 52
52 -
 53
53 -
 54
54 -
 55
55 -
 56
56 -
 57
57 -
 58
58 -
 59
59 -
 60
60 -
 61
61 -
 62
62 -
63
-
64
-
65
-
66
-
67
-
68
-
69
-
70
-
71
-
72
-
73
-
74
-
75
-
76
-
77
-
78
-
79
-
80
-
81
-
82
-
83
-
84
-
85
-
86
-
87
-
88
-
89
-
90
-
91
-
92
-
93
-
94
-
95
-
96
-
97
-
98
-
99
-
100
-
101
-
102
-
103
-
104
-
105
-
106
-
107
-
108
-
109
-
110
-
111
-
112
-
113
-
114
-
115
-
116
-
117
-
118
-
119
-
120
-
121
-
122
-
123
-
124
-
125
-
126
-
127
-
128
-
129
-
130
-
131
-
132
-
133
-
134
-
135
-
136
-
137
-
138
-
139
-
140
-
141
-
142
-
143
-
144
-
145
-
146
-
147
-
148
-
149
-
150
-
151
-
152
 |
 |

44 MANAGEMENT’S DISCUSSION AND ANALYSIS
OF FINANCIAL CONDITION AND RESULTS OF OPERATIONS
Selling, General and Administrative Expenses
SG&A expenses decreased 15% to $4.3 billion, or 14.4% of net sales, in 2008, compared to $5.1 billion, or
13.9% of net sales, in 2007. SG&A expenses decreased in all segments. The decrease in SG&A expenses in the
Mobile Devices segment was primarily driven by lower marketing expenses and savings from cost-reduction
initiatives. The decrease in SG&A expenses in the Home and Networks Mobility and Enterprise Mobility
Solutions segments were primarily due to savings from cost-reduction initiatives. SG&A expenses as a percentage
of net sales increased in the Mobile Devices segment and decreased in the Home and Networks Mobility and
Enterprise Mobility Solutions segments.
Research and Development Expenditures
R&D expenditures decreased 7% to $4.1 billion, or 13.6% of net sales, in 2008, compared to $4.4 billion,
or 12.1% of net sales, in 2007. R&D expenditures decreased in the Mobile Devices and Home and Networks
Mobility segments, partially offset by higher R&D expenditures in the Enterprise Mobility Solutions segment. The
decreases in R&D expenditures in the Mobile Devices and Home and Networks Mobility segments were
primarily due to savings from cost-reduction initiatives. The increase in R&D expenditures in the Enterprise
Mobility Solutions segment was primarily due to developmental engineering expenditures for new product
development and investment in next-generation technologies. R&D expenditures as a percentage of net sales
increased in the Mobile Devices and Enterprise Mobility Solutions segments and decreased in the Home and
Networks Mobility segment.
Other Charges
The Company recorded net charges of $2.3 billion in Other charges in 2008, compared to net charges of
$1.0 billion in 2007. The net charges in 2008 included: (i) $1.8 billion of goodwill and other asset impairment
charges, (ii) $318 million of charges relating to the amortization of intangible assets, (iii) $248 million of net
reorganization of business charges included in Other charges, and (iv) $59 million of transaction costs related to
the proposed separation of the Company into two independent, publicly traded companies, partially offset by a
$48 million gain on the sale of property, plant and equipment. The net charges in 2007 included: (i) $369 million
of charges relating to the amortization of intangibles, (ii) $290 million of net reorganization of business charges
included in Other charges, (iii) $140 million of charges for legal settlements and related insurance matters,
(iv) $96 million of acquisition-related in-process research and development charges (‘‘IPR&D’’) relating to 2007
acquisitions, and (v) $89 million of asset impairment charges. The goodwill and other asset impairment charges
are discussed in further detail in the ‘‘Valuation and Recoverability of Goodwill and Long-lived Assets’’ section.
The net reorganization of business charges are discussed in further detail in the ‘‘Reorganization of Businesses’’
section.
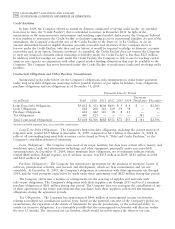
Net Interest Income
Net interest income was $48 million in 2008, compared to net interest income of $91 million in 2007. Net
interest income in 2008 included interest income of $272 million, partially offset by interest expense of
$224 million. Net interest income in 2007 included interest income of $456 million, partially offset by interest
expense of $365 million. The decrease in net interest income was primarily due to lower interest income due to
the decrease in average cash, cash equivalents and Sigma Fund balances in 2008 compared to 2007 and the
significant decrease in short-term interest rates. This decrease was partially offset by a decrease in interest expense
in 2008 due to the reversal of $89 million of interest accruals that were no longer needed as a result of the
effective settlement of certain tax audits.
Gains on Sales of Investments and Businesses
Gains on sales of investments and businesses were $82 million in 2008, compared to $50 million in 2007. In
2008, the net gain primarily related to sales of a number of the Company’s equity investments, of which
$29 million of gain was attributed to a single investment. In 2007, the net gain primarily reflected a gain of
$34 million from the sale of the Company’s embedded communications computing group.
Other
Net charges classified as Other, as presented in Other income (expense), were $372 million in 2008,
compared to net income of $36 million in 2007. The net charges in 2008 were primarily comprised of:
(i) $365 million of investment impairment charges, of which $138 million related to a single strategic investment,