Motorola 2009 Annual Report Download - page 126
Download and view the complete annual report
Please find page 126 of the 2009 Motorola annual report below. You can navigate through the pages in the report by either clicking on the pages listed below, or by using the keyword search tool below to find specific information within the annual report.-
 1
1 -
2
-
3
-
4
-
5
-
6
-
7
-
8
-
9
-
10
-
11
-
12
-
13
-
14
-
15
-
16
-
17
-
18
-
19
-
20
-
21
-
22
-
23
-
24
-
25
-
26
-
27
-
28
-
29
-
30
-
31
-
32
-
33
-
34
-
35
-
36
-
37
-
38
-
39
-
40
-
41
-
42
-
43
-
44
-
45
-
46
-
47
-
48
-
49
-
50
-
51
-
52
-
53
-
54
-
55
-
56
-
57
-
58
-
59
-
60
-
61
-
62
-
63
-
64
-
65
-
66
-
67
-
68
-
69
-
70
-
71
-
72
-
73
-
74
-
75
-
76
-
77
-
78
-
79
-
80
-
81
-
82
-
83
-
84
-
85
-
86
-
87
-
88
-
89
-
90
-
91
-
92
-
93
-
94
-
95
-
96
-
97
-
98
-
99
-
100
-
101
-
102
-
103
-
104
-
105
-
106
-
107
-
108
-
109
-
110
-
111
-
112
-
113
-
114
-
115
-
 116
116 -
 117
117 -
 118
118 -
 119
119 -
 120
120 -
 121
121 -
 122
122 -
 123
123 -
 124
124 -
 125
125 -
 126
126 -
 127
127 -
 128
128 -
 129
129 -
 130
130 -
 131
131 -
 132
132 -
 133
133 -
 134
134 -
 135
135 -
 136
136 -
137
-
138
-
139
-
140
-
141
-
142
-
143
-
144
-
145
-
146
-
147
-
148
-
149
-
150
-
151
-
152
 |
 |

118
12. Information by Segment and Geographic Region
The Company reports financial results for the following business segments:
• The Mobile Devices segment designs, manufactures, sells and services wireless handsets, including
smartphones, with integrated software and accessory products, and licenses intellectual property.
• The Home and Networks Mobility segment designs, manufactures, sells, installs and services: (i) digital
video, Internet Protocol (‘‘IP’’) video and broadcast network interactive set-tops (‘‘digital entertainment
devices’’), end-to-end video distribution systems, broadband access infrastructure platforms, and associated
data and voice customer premise equipment (‘‘broadband gateways’’) to cable television and telecom
service providers (collectively, referred to as the ‘‘home business’’), and (ii) wireless access systems
(‘‘wireless networks’’), including cellular infrastructure systems and wireless broadband systems, to wireless
service providers (collectively, referred to as the ‘‘networks business’’).
• The Enterprise Mobility Solutions segment designs, manufactures, sells, installs and services analog and
digital two-way radios, wireless LAN and security products, voice and data communications products and
systems for private networks, wireless broadband systems and end-to-end enterprise mobility solutions to a
wide range of customers, including government and public safety agencies (which, together with all sales to
distributors of two-way communication products, are referred to as the ‘‘government and public safety
market’’), as well as retail, energy and utilities, transportation, manufacturing, healthcare and other
commercial customers (which, collectively, are referred to as the ‘‘commercial enterprise market’’).
Segment operating results are measured based on operating earnings adjusted, if necessary, for certain
segment-specific items and corporate allocations. Intersegment and intergeographic sales are accounted for on an
arm’s-length pricing basis. Intersegment sales included in other and eliminations were:
Years Ended December 31 2009 2008 2007
Mobile Devices $45 $53 $56
Home and Networks Mobility 4214
Enterprise Mobility Solutions 35 86 58
$84 $141 $128
Identifiable assets (excluding intersegment receivables) are the Company’s assets that are identified with
classes of similar products or operations in each geographic region.
For the year ended December 31, 2009, approximately 11% of net sales were to one customer. No single
customer accounted for more than 10% of net sales for the years ended December 31, 2008 and 2007.
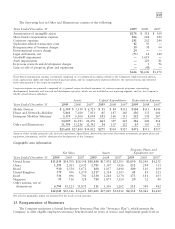
Segment information
Net Sales Operating Earnings (Loss)
Years Ended December 31 2009 2008 2007 2009 2008 2007
Mobile Devices $ 7,146 $12,099 $18,988 $(1,077) $(2,199) $(1,201)
Home and Networks Mobility 7,963 10,086 10,014 558 918 709
Enterprise Mobility Solutions 7,008 8,093 7,729 1,057 1,496 1,213
22,117 30,278 36,731 538 215 721
Other and Eliminations (73) (132) (109) (686) (2,606) (1,274)
$22,044 $30,146 $36,622
Operating earnings (loss) (148) (2,391) (553)
Total other income (expense) (17) (242) 177
Earnings (loss) from continuing operations
before income taxes $ (165) $(2,633) $ (376)