Motorola 2009 Annual Report Download - page 121
Download and view the complete annual report
Please find page 121 of the 2009 Motorola annual report below. You can navigate through the pages in the report by either clicking on the pages listed below, or by using the keyword search tool below to find specific information within the annual report.-
 1
1 -
2
-
3
-
4
-
5
-
6
-
7
-
8
-
9
-
10
-
11
-
12
-
13
-
14
-
15
-
16
-
17
-
18
-
19
-
20
-
21
-
22
-
23
-
24
-
25
-
26
-
27
-
28
-
29
-
30
-
31
-
32
-
33
-
34
-
35
-
36
-
37
-
38
-
39
-
40
-
41
-
42
-
43
-
44
-
45
-
46
-
47
-
48
-
49
-
50
-
51
-
52
-
53
-
54
-
55
-
56
-
57
-
58
-
59
-
60
-
61
-
62
-
63
-
64
-
65
-
66
-
67
-
68
-
69
-
70
-
71
-
72
-
73
-
74
-
75
-
76
-
77
-
78
-
79
-
80
-
81
-
82
-
83
-
84
-
85
-
86
-
87
-
88
-
89
-
90
-
91
-
92
-
93
-
94
-
95
-
96
-
97
-
98
-
99
-
100
-
101
-
102
-
103
-
104
-
105
-
106
-
107
-
108
-
109
-
110
-
 111
111 -
 112
112 -
 113
113 -
 114
114 -
 115
115 -
 116
116 -
 117
117 -
 118
118 -
 119
119 -
 120
120 -
 121
121 -
 122
122 -
 123
123 -
 124
124 -
 125
125 -
 126
126 -
 127
127 -
 128
128 -
 129
129 -
 130
130 -
 131
131 -
132
-
133
-
134
-
135
-
136
-
137
-
138
-
139
-
140
-
141
-
142
-
143
-
144
-
145
-
146
-
147
-
148
-
149
-
150
-
151
-
152
 |
 |

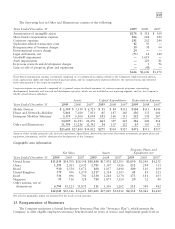
113
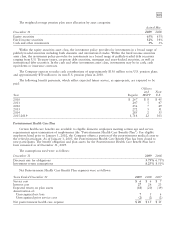
Pension and Postretirement Health Care Plan Assets
The fair value of the various pension and postretirement health care plans’ assets by level in the fair value
hierarchy as of December 31, 2009 were as follows:
Regular Plan
December 31, 2009 Level 1 Level 2 Level 3 Total
Common stock and equivalents $1,225 $ — $ 6 $1,231
Commingled equity funds — 1,416 — 1,416
Preferred stock 3 — 1 4
U.S. government and agency obligations — 119 — 119
Other government bonds — 3 — 3
Corporate bonds — 121 — 121
Mortgage-backed bonds — 178 — 178
Asset-backed bonds — 36 — 36
Commingled bond funds — 718 — 718
Commingled short-term investment funds — 49 — 49
Invested cash — 17 — 17
Total investment securities $1,228 $2,657 $ 7 $3,892
Accrued income receivable 6
Fair value plan assets $3,898
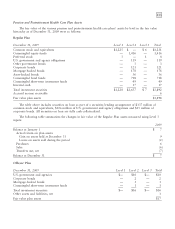
The table above includes securities on loan as part of a securities lending arrangement of $137 million of
common stock and equivalents, $106 million of U.S. government and agency obligations and $15 million of
corporate bonds. All securities on loan are fully cash collateralized.
The following table summarizes the changes in fair value of the Regular Plan assets measured using Level 3
inputs:
2009
Balance at January 1 $7
Actual return on plan assets:
Gain on assets held at December 31 9
Losses on assets sold during the period (2)
Purchases 6
Sales (6)
Transfers out, net (7)
Balance at December 31 $7
Officers’ Plan
December 31, 2009 Level 1 Level 2 Level 3 Total
U.S. government and agencies $— $10 $— $10
Corporate bonds — 2 — 2
Mortgage-backed bonds — 3 — 3
Commingled short-term investment funds — 1 — 1
Total investment securities $— $16 $— $16
Other assets and liabilities, net 1
Fair value plan assets $17