Motorola 2009 Annual Report Download - page 42
Download and view the complete annual report
Please find page 42 of the 2009 Motorola annual report below. You can navigate through the pages in the report by either clicking on the pages listed below, or by using the keyword search tool below to find specific information within the annual report.-
 1
1 -
2
-
3
-
4
-
5
-
6
-
7
-
8
-
9
-
10
-
11
-
12
-
13
-
14
-
15
-
16
-
17
-
18
-
19
-
20
-
21
-
22
-
23
-
24
-
25
-
26
-
27
-
28
-
29
-
30
-
31
-
 32
32 -
 33
33 -
 34
34 -
 35
35 -
 36
36 -
 37
37 -
 38
38 -
 39
39 -
 40
40 -
 41
41 -
 42
42 -
 43
43 -
 44
44 -
 45
45 -
 46
46 -
 47
47 -
 48
48 -
 49
49 -
 50
50 -
 51
51 -
 52
52 -
53
-
54
-
55
-
56
-
57
-
58
-
59
-
60
-
61
-
62
-
63
-
64
-
65
-
66
-
67
-
68
-
69
-
70
-
71
-
72
-
73
-
74
-
75
-
76
-
77
-
78
-
79
-
80
-
81
-
82
-
83
-
84
-
85
-
86
-
87
-
88
-
89
-
90
-
91
-
92
-
93
-
94
-
95
-
96
-
97
-
98
-
99
-
100
-
101
-
102
-
103
-
104
-
105
-
106
-
107
-
108
-
109
-
110
-
111
-
112
-
113
-
114
-
115
-
116
-
117
-
118
-
119
-
120
-
121
-
122
-
123
-
124
-
125
-
126
-
127
-
128
-
129
-
130
-
131
-
132
-
133
-
134
-
135
-
136
-
137
-
138
-
139
-
140
-
141
-
142
-
143
-
144
-
145
-
146
-
147
-
148
-
149
-
150
-
151
-
152
 |
 |

34
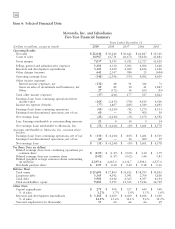
Item 6: Selected Financial Data
Motorola, Inc. and Subsidiaries
Five-Year Financial Summary
Years Ended December 31
(Dollars in millions, except as noted) 2009 2008 2007 2006 2005
Operating Results
Net sales $ 22,044 $ 30,146 $ 36,622 $ 42,847 $ 35,310
Costs of sales 14,987 21,751 26,670 30,120 23,881
Gross margin 7,057 8,395 9,952 12,727 11,429
Selling, general and administrative expenses 3,381 4,330 5,092 4,504 3,628
Research and development expenditures 3,183 4,109 4,429 4,106 3,600
Other charges (income) 641 2,347 984 25 (404)
Operating earnings (loss) (148) (2,391) (553) 4,092 4,605
Other income (expense):
Interest income (expense), net (132) 48 91 326 71
Gains on sales of investments and businesses, net 88 82 50 41 1,845
Other 27 (372) 36 160 (95)
Total other income (expense) (17) (242) 177 527 1,821
Earnings (loss) from continuing operations before
income taxes (165) (2,633) (376) 4,619 6,426
Income tax expense (benefit) (77) 1,607 (285) 1,349 1,893
Earnings (loss) from continuing operations (88) (4,240) (91) 3,270 4,533
Earnings from discontinued operations, net of tax 60 — 56 400 59
Net earnings (loss) (28) (4,240) (35) 3,670 4,592
Less: Earnings attributable to noncontrolling interests 23 414 914
Net earnings (loss) attributable to Motorola, Inc. $ (51) $ (4,244) $ (49) $ 3,661 $ 4,578
Amounts attributable to Motorola, Inc. common share-
holders
Earnings (loss) from continuing operations, net of tax $ (111) $ (4,244) $ (105) $ 3,261 $ 4,519
Earnings from discontinued operations, net of tax 60 — 56 400 59
Net earnings (loss) $ (51) $ (4,244) $ (49) $ 3,661 $ 4,578
Per Share Data (in dollars)
Diluted earnings (loss) from continuing operations per
common share $ (0.05) $ (1.87) $ (0.05) $ 1.30 $ 1.79
Diluted earnings (loss) per common share (0.02) (1.87) (0.02) 1.46 1.81
Diluted weighted average common shares outstanding
(in millions) 2,295.6 2,265.4 2,312.7 2,504.2 2,527.0
Dividends paid per share $ 0.05 $ 0.20 $ 0.20 $ 0.18 $ 0.16
Balance Sheet
Total assets $ 25,603 $ 27,869 $ 34,812 $ 38,593 $ 35,802
Long-term debt 3,365 4,092 3,991 2,704 3,806
Total debt 3,901 4,184 4,323 4,397 4,254
Total stockholders’ equity 9,883 9,595 15,525 17,186 16,709
Other Data
Capital expenditures $ 275 $ 504 $ 527 $ 649 $ 548
% of sales 1.2% 1.7% 1.4% 1.5% 1.6%
Research and development expenditures $ 3,183 $ 4,109 $ 4,429 $ 4,106 $ 3,600
% of sales 14.4% 13.6% 12.1% 9.6% 10.2%
Year-end employment (in thousands) 53 64 66 66 69