Motorola 2009 Annual Report Download - page 67
Download and view the complete annual report
Please find page 67 of the 2009 Motorola annual report below. You can navigate through the pages in the report by either clicking on the pages listed below, or by using the keyword search tool below to find specific information within the annual report.-
 1
1 -
2
-
3
-
4
-
5
-
6
-
7
-
8
-
9
-
10
-
11
-
12
-
13
-
14
-
15
-
16
-
17
-
18
-
19
-
20
-
21
-
22
-
23
-
24
-
25
-
26
-
27
-
28
-
29
-
30
-
31
-
32
-
33
-
34
-
35
-
36
-
37
-
38
-
39
-
40
-
41
-
42
-
43
-
44
-
45
-
46
-
47
-
48
-
49
-
50
-
51
-
52
-
53
-
54
-
55
-
56
-
 57
57 -
 58
58 -
 59
59 -
 60
60 -
 61
61 -
 62
62 -
 63
63 -
 64
64 -
 65
65 -
 66
66 -
 67
67 -
 68
68 -
 69
69 -
 70
70 -
 71
71 -
 72
72 -
 73
73 -
 74
74 -
 75
75 -
 76
76 -
 77
77 -
78
-
79
-
80
-
81
-
82
-
83
-
84
-
85
-
86
-
87
-
88
-
89
-
90
-
91
-
92
-
93
-
94
-
95
-
96
-
97
-
98
-
99
-
100
-
101
-
102
-
103
-
104
-
105
-
106
-
107
-
108
-
109
-
110
-
111
-
112
-
113
-
114
-
115
-
116
-
117
-
118
-
119
-
120
-
121
-
122
-
123
-
124
-
125
-
126
-
127
-
128
-
129
-
130
-
131
-
132
-
133
-
134
-
135
-
136
-
137
-
138
-
139
-
140
-
141
-
142
-
143
-
144
-
145
-
146
-
147
-
148
-
149
-
150
-
151
-
152
 |
 |

59
MANAGEMENT’S DISCUSSION AND ANALYSIS
OF FINANCIAL CONDITION AND RESULTS OF OPERATIONS
In 2008, ASP was flat compared to 2007. By comparison, ASP decreased approximately 9% in 2007 and
decreased approximately 11% in 2006.
The segment has several large customers located throughout the world. In 2008, aggregate net sales to the
segment’s five largest customers accounted for approximately 41% of the segment’s net sales. Besides selling
directly to carriers and operators, the segment also sells products through a variety of third-party distributors and
retailers, which accounted for approximately 24% of the segment’s net sales in 2008.
Although the U.S. market continued to be the segment’s largest individual market, many of our customers,
and 56% of the segment’s 2008 net sales, were outside the U.S. In 2008, the largest of these international
markets were Brazil, China and Mexico.
As the segment’s revenue transactions are largely denominated in local currencies, we are impacted by the
weakening in the value of these local currencies against the U.S. dollar. A number of our more significant
international markets, particularly in Latin America, were impacted by this trend in late 2008.
Home and Networks Mobility Segment
The Home and Networks Mobility segment designs, manufactures, sells, installs and services: (i) digital
video, Internet Protocol video and broadcast network interactive set-tops, end-to-end video distribution systems,
broadband access infrastructure platforms, and associated data and voice customer premise equipment to cable
television and telecom service providers (collectively, referred to as the ‘‘home business’’), and (ii) wireless access
systems, including cellular infrastructure systems and wireless broadband systems, to wireless service providers
(collectively, referred to as the ‘‘network business’’). In 2009, the segment’s net sales represented 36% of the
Company’s consolidated net sales, compared to 33% in 2008 and 27% in 2007.
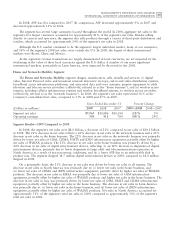
Years Ended December 31 Percent Change
(Dollars in millions) 2009 2008 2007 2009—2008 2008—2007
Segment net sales $7,963 $10,086 $10,014 (21)% 1%
Operating earnings 558 918 709 (39)% 29%
Segment Results—2009 Compared to 2008
In 2009, the segment’s net sales were $8.0 billion, a decrease of 21% compared to net sales of $10.1 billion
in 2008. The 21% decrease in net sales reflects a 22% decrease in net sales in the networks business and a 21%
decrease in net sales in the home business. The 22% decrease in net sales in the networks business was primarily
driven by lower net sales of GSM, CDMA, UMTS and iDEN infrastructure equipment, partially offset by higher
net sales of WiMAX products. The 21% decrease in net sales in the home business was primarily driven by a
24% decrease in net sales of digital entertainment devices, reflecting: (i) an 18% decrease in shipments of digital
entertainment devices, primarily due to lower shipments to large cable and telecommunications operators in
North America as a result of macroeconomic conditions, and (ii) a lower ASP due to an unfavorable shift in
product mix. The segment shipped 14.7 million digital entertainment devices in 2009, compared to 18.0 million
shipped in 2008.
On a geographic basis, the 21% decrease in net sales was driven by lower net sales in all regions. The
decrease in net sales in North America was primarily due to: (i) lower net sales in the home business, and
(ii) lower net sales of CDMA and iDEN infrastructure equipment, partially offset by higher net sales of WiMAX
products. The decrease in net sales in EMEA was primarily due to lower net sales of GSM infrastructure
equipment, partially offset by higher net sales of WiMAX products and higher net sales in the home business. The
decrease in net sales in Asia was primarily driven by lower net sales of GSM, UMTS and CDMA infrastructure
equipment, partially offset by higher net sales in the home business. The decrease in net sales in Latin America
was primarily due to: (i) lower net sales in the home business, and (ii) lower net sales of iDEN infrastructure
equipment, partially offset by higher net sales of WiMAX products. Net sales in North America accounted for
approximately 51% of the segment’s total net sales in 2009, compared to approximately 50% of the segment’s
total net sales in 2008.