Motorola 2009 Annual Report Download - page 98
Download and view the complete annual report
Please find page 98 of the 2009 Motorola annual report below. You can navigate through the pages in the report by either clicking on the pages listed below, or by using the keyword search tool below to find specific information within the annual report.-
 1
1 -
2
-
3
-
4
-
5
-
6
-
7
-
8
-
9
-
10
-
11
-
12
-
13
-
14
-
15
-
16
-
17
-
18
-
19
-
20
-
21
-
22
-
23
-
24
-
25
-
26
-
27
-
28
-
29
-
30
-
31
-
32
-
33
-
34
-
35
-
36
-
37
-
38
-
39
-
40
-
41
-
42
-
43
-
44
-
45
-
46
-
47
-
48
-
49
-
50
-
51
-
52
-
53
-
54
-
55
-
56
-
57
-
58
-
59
-
60
-
61
-
62
-
63
-
64
-
65
-
66
-
67
-
68
-
69
-
70
-
71
-
72
-
73
-
74
-
75
-
76
-
77
-
78
-
79
-
80
-
81
-
82
-
83
-
84
-
85
-
86
-
87
-
 88
88 -
 89
89 -
 90
90 -
 91
91 -
 92
92 -
 93
93 -
 94
94 -
 95
95 -
 96
96 -
 97
97 -
 98
98 -
 99
99 -
 100
100 -
 101
101 -
 102
102 -
 103
103 -
 104
104 -
 105
105 -
 106
106 -
 107
107 -
 108
108 -
109
-
110
-
111
-
112
-
113
-
114
-
115
-
116
-
117
-
118
-
119
-
120
-
121
-
122
-
123
-
124
-
125
-
126
-
127
-
128
-
129
-
130
-
131
-
132
-
133
-
134
-
135
-
136
-
137
-
138
-
139
-
140
-
141
-
142
-
143
-
144
-
145
-
146
-
147
-
148
-
149
-
150
-
151
-
152
 |
 |

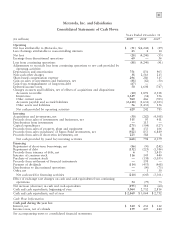
90
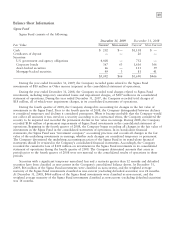
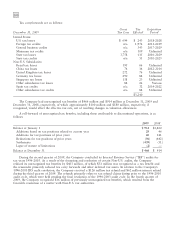
Investments
Investments consist of the following:
Recorded Value Less
Short-term Unrealized Unrealized Cost
December 31, 2009 Investments Investments Gains Losses Basis
Available-for-sale securities:
U.S. government and agency obligations $ — $ 23 $ 1 $— $ 22
Corporate bonds 2 10 — — 12
Mortgage-backed securities — 3 — — 3
Common stock and equivalents — 147 111 (1) 37
2 183 112 (1) 74
Other securities, at cost — 223 — — 223
Equity method investments — 53 — — 53
$ 2 $ 459 $112 $(1) $350
Recorded Value Less
Short-term Unrealized Unrealized Cost
December 31, 2008 Investments Investments Gains Losses Basis
Certificates of deposit $225 $ — $— $— $225
Available-for-sale securities:
U.S. government and agency obligations — 28 1 — 27
Corporate bonds — 11 — — 11
Asset-backed securities — 1 — — 1
Mortgage-backed securities — 4 — — 4
Common stock and equivalents — 117 5 (2) 114
225 161 6 (2) 382
Other securities, at cost — 296 — — 296
Equity method investments — 60 — — 60
$225 $517 $ 6 $(2) $738
At December 31, 2009 and 2008, the Company had $2 million and $225 million, respectively, in short-term
investments (which are highly-liquid fixed-income investments with an original maturity greater than three
months but less than one year).
At December 31, 2009, the Company’s available-for-sale securities portfolio had an approximate fair market
value of $185 million, which represented a cost basis of $74 million and a net unrealized gain of $111 million.
At December 31, 2008, the Company’s available-for-sale securities portfolio had an approximate fair market
value of $161 million, which represented a cost basis of $157 million and a net unrealized gain of $4 million.
During the years ended December 31, 2009, 2008 and 2007, the Company recorded investment impairment
charges of $77 million, $365 million and $44 million, respectively, representing other-than-temporary declines in
the value of the Company’s available-for-sale investment portfolio. Investment impairment charges are included in
Other within Other income (expense) in the Company’s consolidated statements of operations.
Gains on sales of investments and businesses, consists of the following:
Years Ended December 31 2009 2008 2007
Gains on sales of investments, net $92 $82 $17
Gains (loss) on sales of businesses, net (4) —33
$88 $82 $50