Motorola 2009 Annual Report Download - page 103
Download and view the complete annual report
Please find page 103 of the 2009 Motorola annual report below. You can navigate through the pages in the report by either clicking on the pages listed below, or by using the keyword search tool below to find specific information within the annual report.-
 1
1 -
2
-
3
-
4
-
5
-
6
-
7
-
8
-
9
-
10
-
11
-
12
-
13
-
14
-
15
-
16
-
17
-
18
-
19
-
20
-
21
-
22
-
23
-
24
-
25
-
26
-
27
-
28
-
29
-
30
-
31
-
32
-
33
-
34
-
35
-
36
-
37
-
38
-
39
-
40
-
41
-
42
-
43
-
44
-
45
-
46
-
47
-
48
-
49
-
50
-
51
-
52
-
53
-
54
-
55
-
56
-
57
-
58
-
59
-
60
-
61
-
62
-
63
-
64
-
65
-
66
-
67
-
68
-
69
-
70
-
71
-
72
-
73
-
74
-
75
-
76
-
77
-
78
-
79
-
80
-
81
-
82
-
83
-
84
-
85
-
86
-
87
-
88
-
89
-
90
-
91
-
92
-
 93
93 -
 94
94 -
 95
95 -
 96
96 -
 97
97 -
 98
98 -
 99
99 -
 100
100 -
 101
101 -
 102
102 -
 103
103 -
 104
104 -
 105
105 -
 106
106 -
 107
107 -
 108
108 -
 109
109 -
 110
110 -
 111
111 -
 112
112 -
 113
113 -
114
-
115
-
116
-
117
-
118
-
119
-
120
-
121
-
122
-
123
-
124
-
125
-
126
-
127
-
128
-
129
-
130
-
131
-
132
-
133
-
134
-
135
-
136
-
137
-
138
-
139
-
140
-
141
-
142
-
143
-
144
-
145
-
146
-
147
-
148
-
149
-
150
-
151
-
152
 |
 |

95
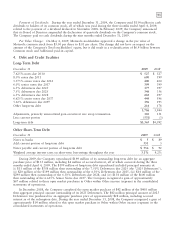
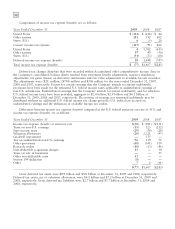
The following table shows the five largest net notional amounts of the positions to buy or sell foreign
currency as of December 31, 2009 and the corresponding positions as of December 31, 2008:
Notional Amount
December 31, December 31,
Net Buy (Sell) by Currency 2009 2008
Euro $(377) $(445)
Brazilian Real (342) (356)
Chinese Renminbi (297) (481)
Japanese Yen (236) 111
British Pound 143 122
The Company did not have any fair value hedge activity during 2009. For the year ended December 31,
2009, income representing the ineffective portions of changes in the fair value of cash flow hedge positions was
de minimus compared to expense of $2 million and income of $1 million for the years ended December 31, 2008
and 2007, respectively. These amounts are included in Other within Other income (expense) in the Company’s
consolidated statements of operations. The above amounts include the change in the fair value of derivative
contracts related to the changes in the difference between the spot price and the forward price. These amounts
are excluded from the measure of effectiveness. Expense (income) related to cash flow hedges that were
discontinued for the years ended December 31, 2009, 2008 and 2007 are included in the amounts noted above.
During the years ended December 31, 2009, 2008 and 2007, on a pre-tax basis, income (expense) of $(18)
million, $3 million and $(16) million, respectively, was reclassified from equity to earnings in the Company’s
consolidated statements of operations.
At December 31, 2009, the maximum term of derivative instruments that hedge forecasted transactions was
13 months. The weighted average duration of the Company’s derivative instruments that hedge forecasted
transactions was six months.
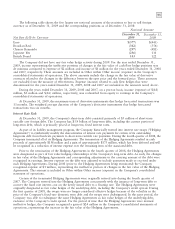
Interest Rate Risk
At December 31, 2009, the Company’s short-term debt consisted primarily of $5 million of short-term
variable rate foreign debt. The Company has $3.9 billion of long-term debt, including the current portion of
long-term debt, which is primarily priced at long-term, fixed interest rates.
As part of its liability management program, the Company historically entered into interest rate swaps (‘‘Hedging
Agreements’’) to synthetically modify the characteristics of interest rate payments for certain of its outstanding
long-term debt from fixed-rate payments to short-term variable rate payments. During the fourth quarter of 2008, the
Company terminated all of its Hedging Agreements. The termination of the Hedging Agreements resulted in cash
proceeds of approximately $158 million and a gain of approximately $173 million, which has been deferred and will
be recognized as a reduction of interest expense over the remaining term of the associated debt.
Prior to the termination of the Hedging Agreements in the fourth quarter of 2008, the Hedging Agreements
were designated as part of fair value hedging relationships of the Company’s long-term debt. As such, the changes
in fair value of the Hedging Agreements and corresponding adjustments to the carrying amount of the debt were
recognized in earnings. Interest expense on the debt was adjusted to include payments made or received under
such Hedging Agreements. During 2008 (prior to the Hedging Agreements being terminated) the Company
recognized expense of $1 million, representing the ineffective portion of changes in the fair value of the Hedging
Agreements. This amount is included in Other within Other income (expense) in the Company’s consolidated
statement of operations.
Certain of the terminated Hedging Agreements were originally entered into during the fourth quarter of
2007. The Company entered into the Hedging Agreements concurrently with the issuance of long-term debt to
convert the fixed rate interest cost on the newly issued debt to a floating rate. The Hedging Agreements were
originally designated as fair value hedges of the underlying debt, including the Company’s credit spread. During
the first quarter of 2008, the swaps were no longer considered effective hedges because of the volatility in the
price of the Company’s fixed-rate domestic term debt and the swaps were dedesignated. In the same period, the
Company was able to redesignate the same Hedging Agreements as fair value hedges of the underlying debt,
exclusive of the Company’s credit spread. For the period of time that the Hedging Agreements were deemed
ineffective hedges, the Company recognized a gain of $24 million in the Company’s consolidated statements of
operations, representing the increase in the fair value of the Hedging Agreements.