Motorola 2009 Annual Report Download - page 89
Download and view the complete annual report
Please find page 89 of the 2009 Motorola annual report below. You can navigate through the pages in the report by either clicking on the pages listed below, or by using the keyword search tool below to find specific information within the annual report.-
 1
1 -
2
-
3
-
4
-
5
-
6
-
7
-
8
-
9
-
10
-
11
-
12
-
13
-
14
-
15
-
16
-
17
-
18
-
19
-
20
-
21
-
22
-
23
-
24
-
25
-
26
-
27
-
28
-
29
-
30
-
31
-
32
-
33
-
34
-
35
-
36
-
37
-
38
-
39
-
40
-
41
-
42
-
43
-
44
-
45
-
46
-
47
-
48
-
49
-
50
-
51
-
52
-
53
-
54
-
55
-
56
-
57
-
58
-
59
-
60
-
61
-
62
-
63
-
64
-
65
-
66
-
67
-
68
-
69
-
70
-
71
-
72
-
73
-
74
-
75
-
76
-
77
-
78
-
 79
79 -
 80
80 -
 81
81 -
 82
82 -
 83
83 -
 84
84 -
 85
85 -
 86
86 -
 87
87 -
 88
88 -
 89
89 -
 90
90 -
 91
91 -
 92
92 -
 93
93 -
 94
94 -
 95
95 -
 96
96 -
 97
97 -
 98
98 -
 99
99 -
100
-
101
-
102
-
103
-
104
-
105
-
106
-
107
-
108
-
109
-
110
-
111
-
112
-
113
-
114
-
115
-
116
-
117
-
118
-
119
-
120
-
121
-
122
-
123
-
124
-
125
-
126
-
127
-
128
-
129
-
130
-
131
-
132
-
133
-
134
-
135
-
136
-
137
-
138
-
139
-
140
-
141
-
142
-
143
-
144
-
145
-
146
-
147
-
148
-
149
-
150
-
151
-
152
 |
 |

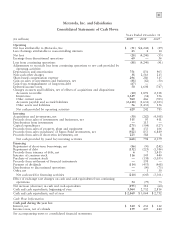
81
Motorola, Inc. and Subsidiaries
Consolidated Statements of Cash Flows
Years Ended December 31
(In millions) 2009 2008 2007
Operating
Net loss attributable to Motorola, Inc. $ (51) $(4,244) $ (49)
Less: Earnings attributable to noncontrolling interests 23 414
Net loss (28) (4,240) (35)
Earnings from discontinued operations 60 —56
Loss from continuing operations (88) (4,240) (91)
Adjustments to reconcile loss from continuing operations to net cash provided by
operating activities:
Depreciation and amortization 751 831 903
Non-cash other charges 38 2,516 213
Share-based compensation expense 296 280 315
Gain on sales of investments and businesses, net (88) (82) (50)
Gain from extinguishment of long-term debt (67) ——
Deferred income taxes 50 1,698 (747)
Changes in assets and liabilities, net of effects of acquisitions and dispositions:
Accounts receivable (10) 1,891 2,538
Inventories 1,349 (54) 556
Other current assets 960 466 (705)
Accounts payable and accrued liabilities (2,618) (1,631) (2,303)
Other assets and liabilities 56 (1,433) 156
Net cash provided by operating activities 629 242 785
Investing
Acquisitions and investments, net (50) (282) (4,568)
Proceeds from sales of investments and businesses, net 315 93 411
Distributions from investments —113 —
Capital expenditures (275) (504) (527)
Proceeds from sales of property, plant and equipment 41 133 166
Proceeds from sales (purchases) of Sigma Fund investments, net (922) 853 6,889
Proceeds from sales of short-term investments, net 223 388 8
Net cash provided by (used for) investing activities (668) 794 2,379
Financing
Repayment of short-term borrowings, net (86) (50) (242)
Repayment of debt (132) (225) (1,386)
Proceeds from issuance of debt, net 67 1,415
Issuance of common stock 116 145 440
Purchase of common stock —(138) (3,035)
Proceeds from settlement of financial instruments —158 —
Payment of dividends (114) (453) (468)
Distributions to discontinued operations —(90) (75)
Other, net —150
Net cash used for financing activities (210) (645) (3,301)
Effect of exchange rate changes on cash and cash equivalents from continuing
operations 54 (79) 73
Net increase (decrease) in cash and cash equivalents (195) 312 (64)
Cash and cash equivalents, beginning of year 3,064 2,752 2,816
Cash and cash equivalents, end of year $ 2,869 $ 3,064 $ 2,752
Cash Flow Information
Cash paid during the year for:
Interest, net $ 320 $ 252 $ 312
Income taxes, net of refunds 159 407 440
See accompanying notes to consolidated financial statements.