Motorola 2009 Annual Report Download - page 106
Download and view the complete annual report
Please find page 106 of the 2009 Motorola annual report below. You can navigate through the pages in the report by either clicking on the pages listed below, or by using the keyword search tool below to find specific information within the annual report.-
 1
1 -
2
-
3
-
4
-
5
-
6
-
7
-
8
-
9
-
10
-
11
-
12
-
13
-
14
-
15
-
16
-
17
-
18
-
19
-
20
-
21
-
22
-
23
-
24
-
25
-
26
-
27
-
28
-
29
-
30
-
31
-
32
-
33
-
34
-
35
-
36
-
37
-
38
-
39
-
40
-
41
-
42
-
43
-
44
-
45
-
46
-
47
-
48
-
49
-
50
-
51
-
52
-
53
-
54
-
55
-
56
-
57
-
58
-
59
-
60
-
61
-
62
-
63
-
64
-
65
-
66
-
67
-
68
-
69
-
70
-
71
-
72
-
73
-
74
-
75
-
76
-
77
-
78
-
79
-
80
-
81
-
82
-
83
-
84
-
85
-
86
-
87
-
88
-
89
-
90
-
91
-
92
-
93
-
94
-
95
-
 96
96 -
 97
97 -
 98
98 -
 99
99 -
 100
100 -
 101
101 -
 102
102 -
 103
103 -
 104
104 -
 105
105 -
 106
106 -
 107
107 -
 108
108 -
 109
109 -
 110
110 -
 111
111 -
 112
112 -
 113
113 -
 114
114 -
 115
115 -
 116
116 -
117
-
118
-
119
-
120
-
121
-
122
-
123
-
124
-
125
-
126
-
127
-
128
-
129
-
130
-
131
-
132
-
133
-
134
-
135
-
136
-
137
-
138
-
139
-
140
-
141
-
142
-
143
-
144
-
145
-
146
-
147
-
148
-
149
-
150
-
151
-
152
 |
 |

98
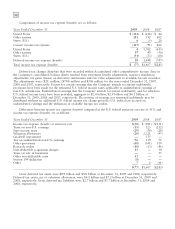
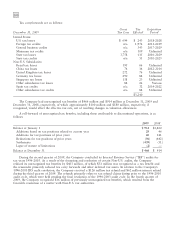
Components of income tax expense (benefit) are as follows:
Years Ended December 31 2009 2008 2007
United States $ (314) $ (618) $ 40
Other nations 181 532 402
States (U.S.) 6(5) 20
Current income tax expense (127) (91) 462
United States 41,702 (633)
Other nations 97 49 (50)
States (U.S.) (51) (53) (64)
Deferred income tax expense (benefit) 50 1,698 (747)
Total income tax expense (benefit) $ (77) $1,607 $(285)
Deferred tax charges (benefits) that were recorded within Accumulated other comprehensive income (loss) in
the Company’s consolidated balance sheets resulted from retirement benefit adjustments, currency translation
adjustments, net gains (losses) on derivative instruments and fair value adjustments to available-for-sale securities.
The adjustments were ($25) million, ($738) million and $306 million for the years ended December 31, 2009,
2008 and 2007, respectively. Except for certain earnings that the Company intends to reinvest indefinitely,
provisions have been made for the estimated U.S. federal income taxes applicable to undistributed earnings of
non-U.S. subsidiaries. Undistributed earnings that the Company intends to reinvest indefinitely, and for which no
U.S. federal income taxes have been provided, aggregate to $2.4 billion, $2.9 billion and $4.1 billion at
December 31, 2009, 2008 and 2007, respectively. The portion of earnings not reinvested indefinitely may be
distributed without an additional U.S. federal income tax charge given the U.S. federal tax accrued on
undistributed earnings and the utilization of available foreign tax credits.
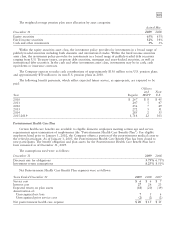
Differences between income tax expense (benefit) computed at the U.S. federal statutory tax rate of 35% and
income tax expense (benefit) are as follows:
Years Ended December 31 2009 2008 2007
Income tax expense (benefit) at statutory rate $(58) $ (921) $(131)
Taxes on non-U.S. earnings (15) 123 (212)
State income taxes (29) (38) (28)
Valuation allowances (28) 2,321 (97)
Goodwill impairment —555 —
Tax on undistributed non-U.S. earnings 96 119 72
Other provisions (48) (541) 119
Research credits (18) (13) (46)
Non-deductible acquisition charges 13 —34
Taxes on sale of businesses ——15
Other non-deductible costs 11 ——
Section 199 deduction (8) ——
Other 72 (11)
$(77) $1,607 $(285)
Gross deferred tax assets were $8.9 billion and $9.8 billion at December 31, 2009 and 2008, respectively.
Deferred tax assets, net of valuation allowances, were $6.0 billion and $7.2 billion at December 31, 2009 and
2008, respectively. Gross deferred tax liabilities were $2.7 billion and $3.7 billion at December 31, 2009 and
2008, respectively.