Motorola 2009 Annual Report Download - page 68
Download and view the complete annual report
Please find page 68 of the 2009 Motorola annual report below. You can navigate through the pages in the report by either clicking on the pages listed below, or by using the keyword search tool below to find specific information within the annual report.-
 1
1 -
2
-
3
-
4
-
5
-
6
-
7
-
8
-
9
-
10
-
11
-
12
-
13
-
14
-
15
-
16
-
17
-
18
-
19
-
20
-
21
-
22
-
23
-
24
-
25
-
26
-
27
-
28
-
29
-
30
-
31
-
32
-
33
-
34
-
35
-
36
-
37
-
38
-
39
-
40
-
41
-
42
-
43
-
44
-
45
-
46
-
47
-
48
-
49
-
50
-
51
-
52
-
53
-
54
-
55
-
56
-
57
-
 58
58 -
 59
59 -
 60
60 -
 61
61 -
 62
62 -
 63
63 -
 64
64 -
 65
65 -
 66
66 -
 67
67 -
 68
68 -
 69
69 -
 70
70 -
 71
71 -
 72
72 -
 73
73 -
 74
74 -
 75
75 -
 76
76 -
 77
77 -
 78
78 -
79
-
80
-
81
-
82
-
83
-
84
-
85
-
86
-
87
-
88
-
89
-
90
-
91
-
92
-
93
-
94
-
95
-
96
-
97
-
98
-
99
-
100
-
101
-
102
-
103
-
104
-
105
-
106
-
107
-
108
-
109
-
110
-
111
-
112
-
113
-
114
-
115
-
116
-
117
-
118
-
119
-
120
-
121
-
122
-
123
-
124
-
125
-
126
-
127
-
128
-
129
-
130
-
131
-
132
-
133
-
134
-
135
-
136
-
137
-
138
-
139
-
140
-
141
-
142
-
143
-
144
-
145
-
146
-
147
-
148
-
149
-
150
-
151
-
152
 |
 |

60 MANAGEMENT’S DISCUSSION AND ANALYSIS
OF FINANCIAL CONDITION AND RESULTS OF OPERATIONS
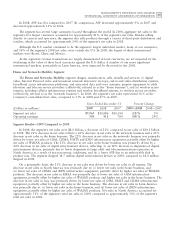
The segment had operating earnings of $558 million in 2009, a decrease of 39% compared to operating
earnings of $918 million in 2008. The decrease in operating earnings was primarily due to a decrease in gross
margin, driven by the 21% decrease in net sales, partially offset by a favorable product mix. Also contributing to
the decrease in operating earnings was: (i) a $75 million charge related to a legal settlement, and (ii) $39 million
of charges related to a facility impairment. These factors were partially offset by decreases in both R&D
expenditures and SG&A expenses, reflecting savings from cost-reduction initiatives. As a percentage of net sales
in 2009 as compared to 2008, gross margin, SG&A expenses and R&D expenditures increased. The segment’s
gross margin percentages differ among its services, software and equipment products. Accordingly, the aggregate
gross margin of the segment can fluctuate from period to period depending upon the relative mix of sales in the
given period.
Due to the nature of the segment’s business, many of the agreements the segment enters into are long-term
contracts that require sizeable investments by our customers. The segment is dependent upon a small number of
customers for a significant portion of its sales. In both 2009 and 2008, sales to the segment’s top five customers
represented approximately 45% of the segment’s net sales. The loss of one of these major customers could have a
significant impact on the segment’s business and, because many of these contracts are long-term in nature, could
impact revenue and earnings over several quarters. The segment’s backlog was $2.1 billion at December 31, 2009,
compared to $2.3 billion at December 31, 2008.
In the home business, demand for the segment’s products depends primarily on the level of capital spending
by broadband operators for constructing, rebuilding or upgrading their communications systems, and for offering
advanced services. In 2009, our digital video customers in North America decreased their purchases of the
segment’s products and services, primarily driven by the difficult macroeconomic conditions that forced them to
reduce their capital expenditures. The reduction in purchases was also driven by the introduction of low-end
digital adapters by Motorola and our competitors.
In the networks business, the segment has been a long-standing proponent of WiMAX and is now
commercially deploying this technology to multiple customers on a global basis. The segment has signed trial
agreements for infrastructure equipment utilizing LTE technology. LTE has widespread industry support, not only
from current GSM/UMTS operators, but also from CDMA/EV-DO based carriers.
Segment Results—2008 Compared to 2007
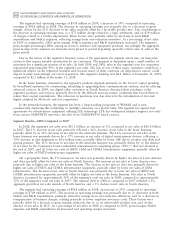
In 2008, the segment’s net sales were $10.1 billion, an increase of 1% compared to net sales of $10.0 billion
in 2007. The 1% increase in net sales primarily reflected a 16% increase in net sales in the home business,
partially offset by an 11% decrease in net sales in the networks business. The 16% increase in net sales in the
home business was primarily driven by a 17% increase in net sales of digital entertainment devices, reflecting a
19% increase in unit shipments to 18.0 million units, partially offset by lower ASP due to product mix shift and
pricing pressure. The 11% decrease in net sales in the networks business was primarily driven by: (i) the absence
of net sales by the Company’s former embedded communication computing group (‘‘ECC’’) that was divested at
the end of 2007, and (ii) lower net sales of iDEN, GSM and CDMA infrastructure equipment, partially offset by
higher net sales of UMTS infrastructure equipment.
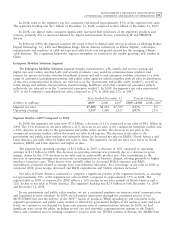
On a geographic basis, the 1% increase in net sales was primarily driven by higher net sales in Latin America
and Asia, partially offset by lower net sales in North America. The increase in net sales in Latin America was
primarily due to higher net sales in the home business. The increase in net sales in Asia was primarily driven by
higher net sales of UMTS and CDMA infrastructure equipment, partially offset by lower net sales of GSM
infrastructure. The decrease in net sales in North America was primarily due to lower net sales of iDEN and
CDMA infrastructure equipment, partially offset by higher net sales in the home business. Net sales in North
America accounted for approximately 50% of the segment’s total net sales in 2008, compared to approximately
52% of the segment’s total net sales in 2007. The regional shift in 2008 as compared to 2007 reflected a 5%
aggregate growth in net sales outside of North America and a 3% decline in net sales in North America.
The segment had operating earnings of $918 million in 2008, an increase of 29% compared to operating
earnings of $709 million in 2007. The increase in operating earnings was primarily due to: (i) decreases in both
SG&A and R&D expenditures, primarily related to savings from cost-reduction initiatives, and (ii) a decrease in
reorganization of business charges, relating primarily to lower employee severance costs. These factors were
partially offset by a decrease in gross margin, primarily due to: (i) an unfavorable product mix, and (ii) the
absence of net sales by ECC. As a percentage of net sales in 2008 as compared to 2007, gross margin, SG&A
expenses and R&D expenditures all decreased and operating margin increased.