Motorola 2009 Annual Report Download - page 137
Download and view the complete annual report
Please find page 137 of the 2009 Motorola annual report below. You can navigate through the pages in the report by either clicking on the pages listed below, or by using the keyword search tool below to find specific information within the annual report.-
 1
1 -
2
-
3
-
4
-
5
-
6
-
7
-
8
-
9
-
10
-
11
-
12
-
13
-
14
-
15
-
16
-
17
-
18
-
19
-
20
-
21
-
22
-
23
-
24
-
25
-
26
-
27
-
28
-
29
-
30
-
31
-
32
-
33
-
34
-
35
-
36
-
37
-
38
-
39
-
40
-
41
-
42
-
43
-
44
-
45
-
46
-
47
-
48
-
49
-
50
-
51
-
52
-
53
-
54
-
55
-
56
-
57
-
58
-
59
-
60
-
61
-
62
-
63
-
64
-
65
-
66
-
67
-
68
-
69
-
70
-
71
-
72
-
73
-
74
-
75
-
76
-
77
-
78
-
79
-
80
-
81
-
82
-
83
-
84
-
85
-
86
-
87
-
88
-
89
-
90
-
91
-
92
-
93
-
94
-
95
-
96
-
97
-
98
-
99
-
100
-
101
-
102
-
103
-
104
-
105
-
106
-
107
-
108
-
109
-
110
-
111
-
112
-
113
-
114
-
115
-
116
-
117
-
118
-
119
-
120
-
121
-
122
-
123
-
124
-
125
-
126
-
 127
127 -
 128
128 -
 129
129 -
 130
130 -
 131
131 -
 132
132 -
 133
133 -
 134
134 -
 135
135 -
 136
136 -
 137
137 -
 138
138 -
 139
139 -
 140
140 -
 141
141 -
 142
142 -
 143
143 -
 144
144 -
 145
145 -
 146
146 -
 147
147 -
148
-
149
-
150
-
151
-
152
 |
 |

129
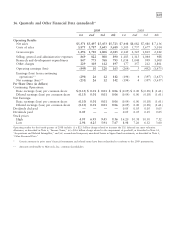
16. Quarterly and Other Financial Data (unaudited)*
2009 2008
1st 2nd 3rd 4th 1st 2nd 3rd 4th
Operating Results
Net sales $5,371 $5,497 $5,453 $5,723 $7,448 $8,082 $7,480 $ 7,136
Costs of sales 3,875 3,787 3,645 3,680 5,303 5,757 5,677 5,014
Gross margin 1,496 1,710 1,808 2,043 2,145 2,325 1,803 2,122
Selling, general and administrative expenses 869 822 800 890 1,183 1,115 1,044 988
Research and development expenditures 847 775 768 793 1,054 1,048 999 1,008
Other charges 229 103 112 197 177 157 212 1,801
Operating earnings (loss) (449) 10 128 163 (269) 5 (452) (1,675)
Earnings (loss) from continuing
operations** (291) 26 12 142 (194) 4 (397) (3,657)
Net earnings (loss)** (231) 26 12 142 (194) 4 (397) (3,657)
Per Share Data (in dollars)
Continuing Operations:
Basic earnings (loss) per common share $ (0.13) $ 0.01 $ 0.01 $ 0.06 $ (0.09) $ 0.00 $ (0.18) $ (1.61)
Diluted earnings (loss) per common share (0.13) 0.01 0.01 0.06 (0.09) 0.00 (0.18) (1.61)
Net Earnings:
Basic earnings (loss) per common share (0.10) 0.01 0.01 0.06 (0.09) 0.00 (0.18) (1.61)
Diluted earnings (loss) per common share (0.10) 0.01 0.01 0.06 (0.09) 0.00 (0.18) (1.61)
Dividends declared ————0.05 0.05 0.05 0.05
Dividends paid 0.05 — — — 0.05 0.05 0.05 0.05
Stock prices
High 4.95 6.95 9.45 9.36 16.20 10.38 10.50 7.52
Low 2.98 4.25 5.91 7.67 8.98 7.20 6.52 3.00
Operating results for the fourth quarter of 2008 include: (i) a $2.1 billion charge related to increase the U.S. deferred tax asset valuation
allowance, as described in Note 6, ‘‘Income Taxes,’’ (ii) a $1.6 billion charge related to the impairment of goodwill, as described in Note 14,
‘‘Acquisitions and Related Intangibles,’’ and (iii) accumulated temporary unrealized losses in Sigma Fund investments, as described in Note 3,
‘‘Other Financial Data.’’
* Certain amounts in prior years’ financial statements and related notes have been reclassified to conform to the 2009 presentation.
** Amounts attributable to Motorola, Inc. common shareholders.