Motorola 2009 Annual Report Download - page 41
Download and view the complete annual report
Please find page 41 of the 2009 Motorola annual report below. You can navigate through the pages in the report by either clicking on the pages listed below, or by using the keyword search tool below to find specific information within the annual report.-
 1
1 -
2
-
3
-
4
-
5
-
6
-
7
-
8
-
9
-
10
-
11
-
12
-
13
-
14
-
15
-
16
-
17
-
18
-
19
-
20
-
21
-
22
-
23
-
24
-
25
-
26
-
27
-
28
-
29
-
30
-
 31
31 -
 32
32 -
 33
33 -
 34
34 -
 35
35 -
 36
36 -
 37
37 -
 38
38 -
 39
39 -
 40
40 -
 41
41 -
 42
42 -
 43
43 -
 44
44 -
 45
45 -
 46
46 -
 47
47 -
 48
48 -
 49
49 -
 50
50 -
 51
51 -
52
-
53
-
54
-
55
-
56
-
57
-
58
-
59
-
60
-
61
-
62
-
63
-
64
-
65
-
66
-
67
-
68
-
69
-
70
-
71
-
72
-
73
-
74
-
75
-
76
-
77
-
78
-
79
-
80
-
81
-
82
-
83
-
84
-
85
-
86
-
87
-
88
-
89
-
90
-
91
-
92
-
93
-
94
-
95
-
96
-
97
-
98
-
99
-
100
-
101
-
102
-
103
-
104
-
105
-
106
-
107
-
108
-
109
-
110
-
111
-
112
-
113
-
114
-
115
-
116
-
117
-
118
-
119
-
120
-
121
-
122
-
123
-
124
-
125
-
126
-
127
-
128
-
129
-
130
-
131
-
132
-
133
-
134
-
135
-
136
-
137
-
138
-
139
-
140
-
141
-
142
-
143
-
144
-
145
-
146
-
147
-
148
-
149
-
150
-
151
-
152
 |
 |

9MAR201022373994
33
PART II
Item 5: Market for Registrant’s Common Equity, Related Stockholder Matters and Issuer
Purchases of Equity Securities
Motorola’s common stock is listed on the New York and Chicago Stock Exchanges. The number of
stockholders of record of Motorola common stock on January 31, 2010 was 73,085.
Information regarding securities authorized for issuance under equity compensation plans is incorporated by
reference to the information under the caption ‘‘Equity Compensation Plan Information’’ of Motorola’s Proxy
Statement for the 2010 Annual Meeting of Stockholders. The remainder of the response to this Item incorporates
by reference Note 16, ‘‘Quarterly and Other Financial Data (unaudited)’’ of the Notes to Consolidated Financial
Statements appearing under ‘‘Item 8: Financial Statements and Supplementary Data’’.
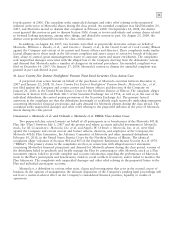
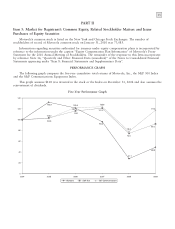
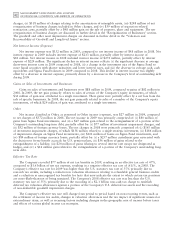
PERFORMANCE GRAPH
The following graph compares the five-year cumulative total returns of Motorola, Inc., the S&P 500 Index
and the S&P Communications Equipment Index.
This graph assumes $100 was invested in the stock or the Index on December 31, 2004 and also assumes the
reinvestment of dividends.
Five-Year Performance Graph
48.8
132.3
27.7
96.0
121.5
92.0
103.0
74.5
121.2
116.1
117.3
102.3
122.6 123.6
78.2
0
20
40
60
80
100
120
140
2004 2005 2006 2007 2008 2009
Motorola S&P 500 S&P Communications