Kroger 2012 Annual Report Download - page 96
Download and view the complete annual report
Please find page 96 of the 2012 Kroger annual report below. You can navigate through the pages in the report by either clicking on the pages listed below, or by using the keyword search tool below to find specific information within the annual report.-
 1
1 -
2
-
3
-
4
-
5
-
6
-
7
-
8
-
9
-
10
-
11
-
12
-
13
-
14
-
15
-
16
-
17
-
18
-
19
-
20
-
21
-
22
-
23
-
24
-
25
-
26
-
27
-
28
-
29
-
30
-
31
-
32
-
33
-
34
-
35
-
36
-
37
-
38
-
39
-
40
-
41
-
42
-
43
-
44
-
45
-
46
-
47
-
48
-
49
-
50
-
51
-
52
-
53
-
54
-
55
-
56
-
57
-
58
-
59
-
60
-
61
-
62
-
63
-
64
-
65
-
66
-
67
-
68
-
69
-
70
-
71
-
72
-
73
-
74
-
75
-
76
-
77
-
78
-
79
-
80
-
81
-
82
-
83
-
84
-
85
-
 86
86 -
 87
87 -
 88
88 -
 89
89 -
 90
90 -
 91
91 -
 92
92 -
 93
93 -
 94
94 -
 95
95 -
 96
96 -
 97
97 -
 98
98 -
 99
99 -
 100
100 -
 101
101 -
 102
102 -
 103
103 -
 104
104 -
 105
105 -
 106
106 -
107
-
108
-
109
-
110
-
111
-
112
-
113
-
114
-
115
-
116
-
117
-
118
-
119
-
120
-
121
-
122
-
123
-
124
-
125
-
126
-
127
-
128
-
129
-
130
-
131
-
132
-
133
-
134
-
135
-
136
 |
 |
A-38
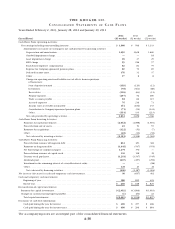
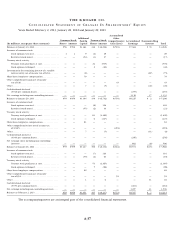
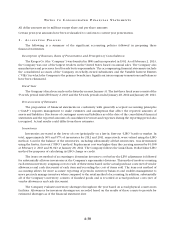
NO T E S T O C O N S O L I D A T E D F I N A N C I A L S T A T E M E N T S
All dollar amounts are in millions except share and per share amounts.
Certain prior-year amounts have been reclassified to conform to current year presentation.
1 . A C C O U N T I N G P O L I C I E S
The following is a summary of the significant accounting policies followed in preparing these
financial statements.
Description of Business, Basis of Presentation and Principles of Consolidation
The Kroger Co. (the “Company”) was founded in 1883 and incorporated in 1902. As of February 2, 2013,
the Company was one of the largest retailers in the United States based on annual sales. The Company also
manufactures and processes food for sale by its supermarkets. The accompanying financial statements include
the consolidated accounts of the Company, its wholly-owned subsidiaries and the Variable Interest Entities
(“VIEs”) in which the Company is the primary beneficiary. Significant intercompany transactions and balances
have been eliminated.
Fiscal Year
The Company’s fiscal year ends on the Saturday nearest January 31. The last three fiscal years consist of the
53-week period ended February 2, 2013 and the 52-week periods ended January 28, 2012 and January 29, 2011.
Pervasiveness of Estimates
The preparation of financial statements in conformity with generally accepted accounting principles
(“GAAP”) requires management to make estimates and assumptions that affect the reported amounts of
assets and liabilities. Disclosure of contingent assets and liabilities as of the date of the consolidated financial
statements and the reported amounts of consolidated revenues and expenses during the reporting period also
is required. Actual results could differ from those estimates.
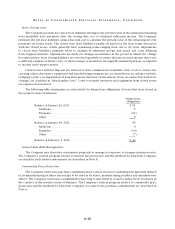
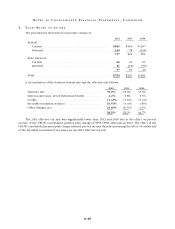
Inventories
Inventories are stated at the lower of cost (principally on a last-in, first-out “LIFO” basis) or market. In
total, approximately 96% and 97% of inventories for 2012 and 2011, respectively, were valued using the LIFO
method. Cost for the balance of the inventories, including substantially all fuel inventories, was determined
using the first-in, first-out (“FIFO”) method. Replacement cost was higher than the carrying amount by $1,098
at February 2, 2013 and $1,043 at January 28, 2012. The Company follows the Link-Chain, Dollar-Value LIFO
method for purposes of calculating its LIFO charge or credit.
The item-cost method of accounting to determine inventory cost before the LIFO adjustment is followed
for substantially all store inventories at the Company’s supermarket divisions. This method involves counting
each item in inventory, assigning costs to each of these items based on the actual purchase costs (net of vendor
allowances and cash discounts) of each item and recording the cost of items sold. The item-cost method of
accounting allows for more accurate reporting of periodic inventory balances and enables management to
more precisely manage inventory when compared to the retail method of accounting. In addition, substantially
all of the Company’s inventory consists of finished goods and is recorded at actual purchase costs (net of
vendor allowances and cash discounts).
The Company evaluates inventory shortages throughout the year based on actual physical counts in its
facilities. Allowances for inventory shortages are recorded based on the results of these counts to provide for
estimated shortages as of the financial statement date.